

Image Source: Pixabay
- EUR/USD halts its two-day winning streak ahead of monetary decisions from both economies.
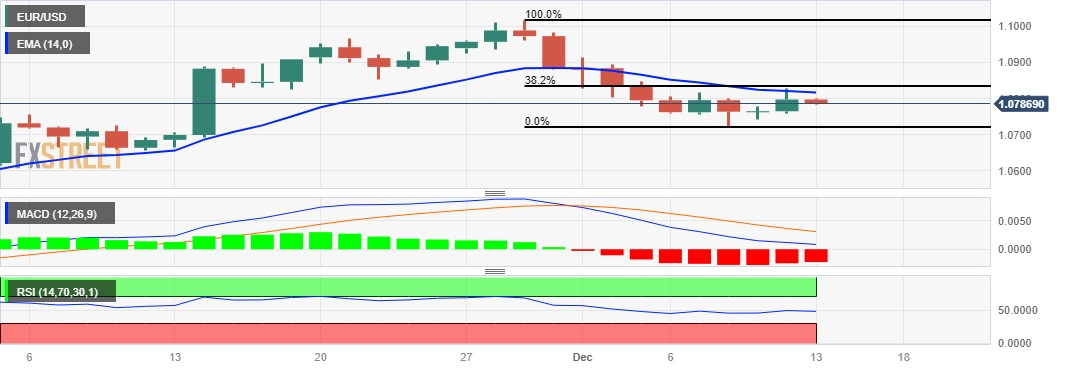
- Technical indicators suggest a potential revisit to the weekly low at 1.0741.
- A breakthrough above the 1.0800 level could lead the pair to reach the 14-day EMA at 1.0816.
EUR/USD halts to continue a two-day winning streak ahead of the monetary policy decisions from the United States (US) and the Eurozone on Wednesday and Thursday, respectively. The EUR/USD pair traded lower around 1.0790 during the Asian session on Wednesday.
The technical signals for the EUR/USD pair favor the ongoing downward movement. With the 14-day Relative Strength Index (RSI) staying below the 50 mark, there's a bearish sentiment suggesting a potential revisit to the major support at the 1.0750 level before the weekly low at 1.0741.
If the pair manages to break below the latter, it could put pressure on the EUR/USD pair to navigate the four-week low at the 1.0723 level followed by the psychological support region around the 1.0700 level.
Additionally, the Moving Average Convergence Divergence (MACD) suggests the weakening of the overall positive momentum as the MACD line is positioned above the centerline but exhibits divergence below the signal line. This shows a potential shift in the direction of the trend.
On the upside, the EUR/USD pair could find a key resistance around the psychological region at the 1.0800 level. A breakthrough above the barrier could reinforce the strength of the EUR/USD pair to explore the area around the 14-day Exponential Moving Average (EMA) at 1.0816 followed by the 38.2% Fibonacci retracement at 1.0833. If the EUR/USD pair surpasses these levels, the major level at 1.0850 could be tested as a further barrier.
EUR/USD: Daily Chart
EUR/USD: ADDITIONAL LEVELS TO WATCH
| OVERVIEW | |
|---|---|
| Today last price | 1.0789 |
| Today Daily Change | -0.0008 |
| Today Daily Change % | -0.07 |
| Today daily open | 1.0797 |
| TRENDS | |
|---|---|
| Daily SMA20 | 1.0869 |
| Daily SMA50 | 1.0717 |
| Daily SMA100 | 1.0758 |
| Daily SMA200 | 1.0825 |
| LEVELS | |
|---|---|
| Previous Daily High | 1.0828 |
| Previous Daily Low | 1.076 |
| Previous Weekly High | 1.0895 |
| Previous Weekly Low | 1.0724 |
| Previous Monthly High | 1.1017 |
| Previous Monthly Low | 1.0517 |
| Daily Fibonacci 38.2% | 1.0802 |
| Daily Fibonacci 61.8% | 1.0786 |
| Daily Pivot Point S1 | 1.0762 |
| Daily Pivot Point S2 | 1.0727 |
| Daily Pivot Point S3 | 1.0694 |
| Daily Pivot Point R1 | 1.083 |
| Daily Pivot Point R2 | 1.0863 |
| Daily Pivot Point R3 | 1.0899 |
More By This Author:
GBP/USD Hovers Above 1.2550 Ahead Of UK GDP, Fed Policy DecisionAUD/NZD Price Analysis: Looking Bearish After Falling Back Into 1.0700
Silver Price Analysis: XAG/USD Struggles At 50-DMA And Slumps Below $23.00


Comments
Log in or sign up to join the conversation.