EUR/USD Price Analysis: Heading For Straight 8 Weeks Of Losses
Today’s EUR/USD price analysis is bearish. The dollar was on course for its lengthiest weekly winning streak in nine years on Friday. Meanwhile, the euro, the dollar index’s primary component, faced eight consecutive weeks of losses.
–Are you interested to learn more about MT5 brokers? Check our detailed guide-
Robust economic data drove the dollar’s strength. Consequently, investors are questioning the Federal Reserve’s aggressive rate-hike strategy. Dane Cekov, a senior macro and FX strategist at Nordea Markets, remarked, “The focus has returned to the relative disparity between the US and European economies, causing the weakening dollar narrative to fade.”
This week’s data revealed unexpected growth in the US services sector for August. Moreover, the US reported the lowest jobless claims since February. In contrast, in July, there was a slightly larger-than-anticipated decline in industrial production in Germany, the largest European economy.
Cekov from Nordea noted, “While the US economy continues to show strength, the European economy appears to be plateauing. The dollar typically performs well when the US outpaces its counterparts, and currently, the US stands out.”
Elsewhere, most economists surveyed by Reuters expect the European Central Bank to maintain interest rates on September 14. However, just under half anticipate another hike this year to combat inflation.
ECB President Christine Lagarde increased the likelihood of pausing with her July news conference statement, “Do we have more ground to cover? At this point, I wouldn’t say so.”
EUR/USD key events today
Investors will absorb data from the busy week as the US and the Eurozone will not release any major reports today.
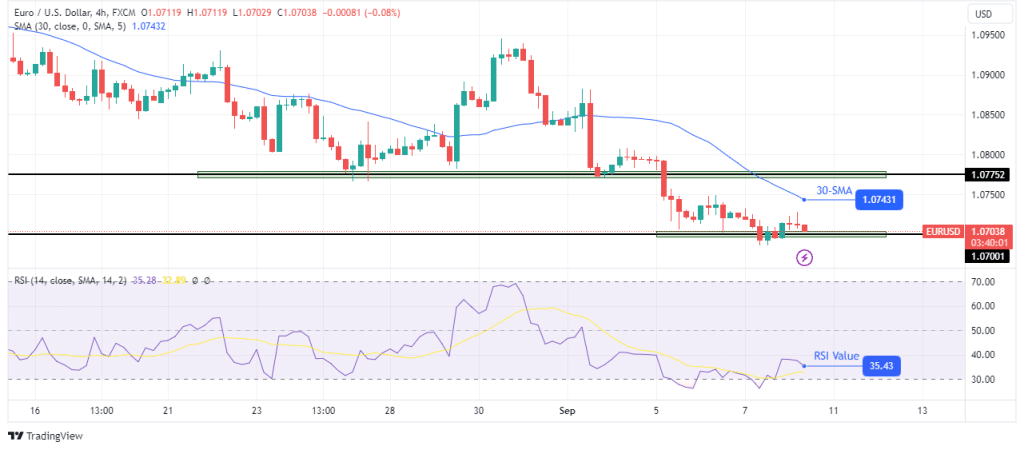
EUR/USD technical price analysis: Sellers eye a break below 1.0700 support.

EUR/USD 4-hour chart
The EUR/USD is making another attempt at the 1.0700 support level on the charts. The pair extended the previous downtrend when the price broke below the 1.0775 support level. Now, it has paused at yet another strong support level.
The indicators on the chart point to a continuation of the downtrend. The 30-SMA is above the price, showing bears are holding the reins. Similarly, the RSI supports sellers as it trades near the oversold region. Therefore, sellers might soon push below the 1,0700 support.
More By This Author:
GBP/USD Outlook: Dollar’s Longest Weekly Rally In A DecadeGold Price Struggling To Rebound After Upbeat Jobs Data
USD/JPY Outlook: Hits 8-Month Top Amid Firm Greenback
Disclaimer: Foreign exchange (Forex) trading carries a high level of risk and may not be suitable for all investors. The risk grows as the leverage is higher. Investment objectives, risk ...
more


