
The EUR/USD pair faces an intense sell-off after breaking below the round-level support of 1.0800 and posts a fresh three-week low at 1.0777 in Thursday’s European session. The major currency pair weakens after a sharp recovery in the US Dollar (USD). The US Dollar Index (DXY), which tracks the Greenback’s value against six major currencies, surges to 104.40 after recovering from a fresh weekly low of 103.86.
The US Dollar rose as market participants had already discounted the Federal Reserve’s (Fed) dovish guidance on interest rates in the monetary policy announcement on Wednesday. The Fed kept borrowing rates steady in the range of 5.25%-5.50%. Fed Chair Jerome Powell said policymakers have gained greater confidence from the Q2 inflation data.
When asked about rate cuts in September, Powell replied, "If we were to see inflation moving down more or less in line with expectations, growth remains reasonably strong, and the labor market remains consistent with current conditions, then I think a rate cut could be on the table at the September meeting”, Reuters reported.
Going forward, investors will focus on the United States (US) ISM Manufacturing PMI and Nonfarm Payrolls (NFP) report for July, which will be published at 14:00 GMT and on Friday, respectively.
Meanwhile, faster-than-expected growth in preliminary Eurozone Harmonized Index of Consumer Prices (HICP) data for July has raised doubts about whether the European Central Bank (ECB) will cut interest rates in September.
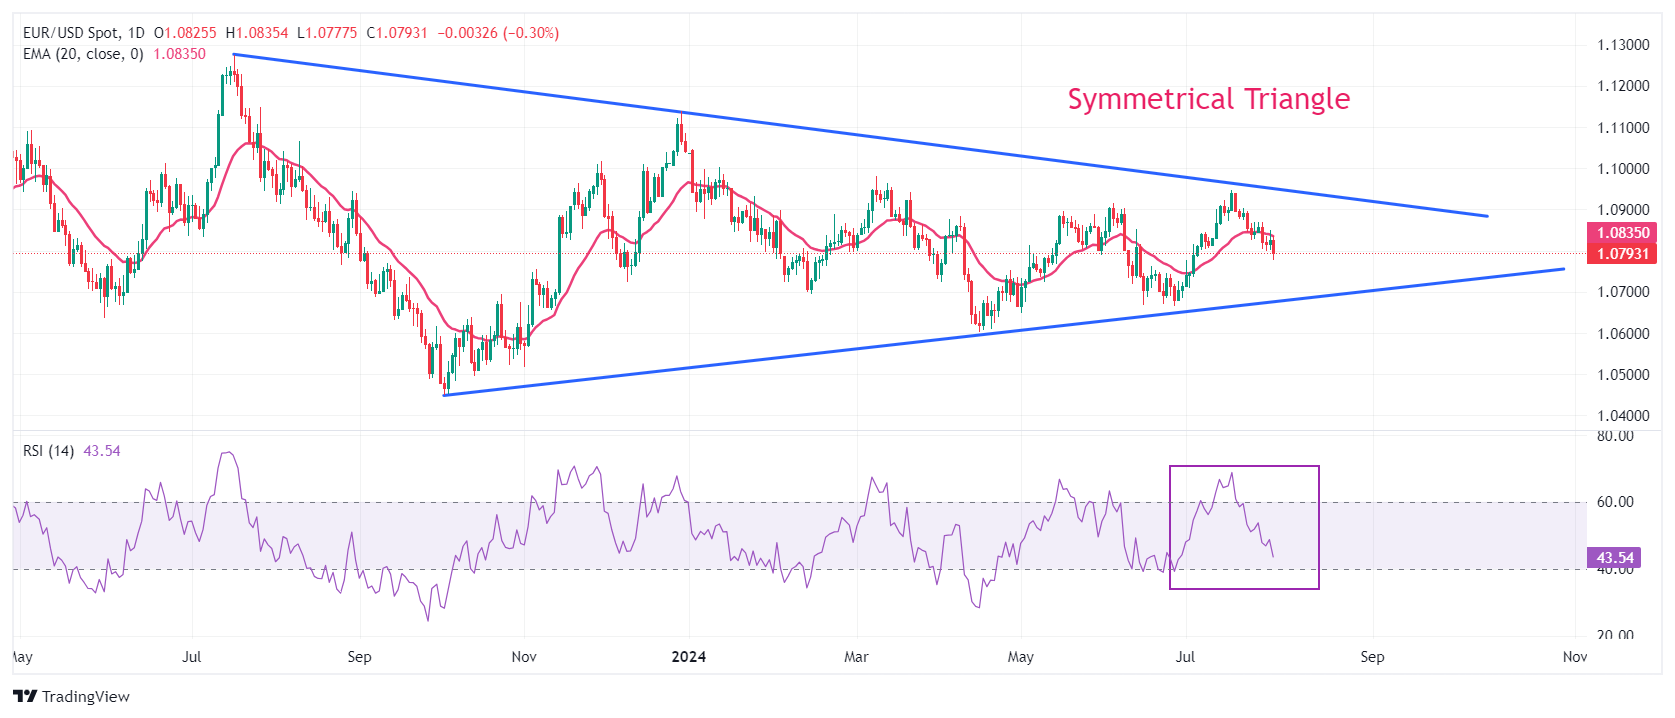
EUR/USD trades inside a Symmetrical Triangle formation on a daily timeframe, which exhibits a sideways trend. The aforementioned chart pattern signifies a sharp volatility contraction, which is expected to remain for a while amid the absence of clear signals of a breakout or a breakdown.
The shared currency pair faces selling pressure near the 20-day Exponential Moving Average (EMA) around 1.0835, suggesting that the near-term trend is bearish.
The 14-day Relative Strength Index (RSI) oscillates in the 40.00-60.00 range, indicating indecisiveness among market participants.
A fresh downside could appear if the asset breaks below the round-level support of 1.0700, which will expose the asset to June 26 low at 1.0666, followed by April 16 low around 1.0600.
On the flip side, an upside move above June 3 high near 1.0900 will drive the asset towards July 17 high at 1.0948 and the psychological resistance of 1.1000.
EUR/USD daily chart
(Click on image to enlarge)
More By This Author:
Silver Price Tumbles To Near $28.70 As USs Dollar Recovers Ahead Of US DataUS Dollar Edges Lower In Countdown To Fed Policy
Gold Price Gains On Middle East Tensions, Focus Is On Fed Policy


Comments
Log in or sign up to join the conversation.