
The EUR/USD remains barely unchanged on thin trading after the US Bureau of Economic Analysis (BEA) revealed the Federal Reserve’s preferred gauge for inflation, the Core Personal Consumption Expenditure (PCE) price index for February was aligned with estimates. That said, the EUR/USD trades at 1.0788, posting minuscule gains of 0.02%
EUR/USD posts minimal movement after US inflation data
The BEA revealed that Core PCE came at 0.3% MoM and at 2.8% YoY, with both figures aligned with the market consensus. Headline PCE figures rose by 0.3% MoM lower than expected and January’s data. In the 12 months to February, PCE came at 2.5%, as foreseen, but a tenth higher than the prior month’s data.
Other data showed that Wholesale Inventories Advanced for February came at 0.5% MoM up from -0.2% in the previous month.
Thin liquidity conditions witnessed the EUR/USD push below 1.0780 before breaking above 1.0790. Buyers are eyeing a clear break above 1.0800, though they will face some intraday resistance, as depicted by the hourly chart, with the 50-Simple Moving Average (SMA) standing at 1.0800.
In addition, traders will watch San Francisco’s Fed President Mary Daly's speech at 15:20 GMT, followed by Fed Chair Jerome Powell's speech at 15:30 GMT.
According to BBH analysts, Fed Chair Jerome Powell's speech will be important. They noted, “Other Fed speakers have tilted hawkish after last week’s FOMC meeting, and markets will be watching to see if Powell follows suit or maintains the dovish tone from his press conference. With Powell, it’s always a coin toss but as we’ve said countless times before, the data will ultimately decide the timing of the first cut. As things stand, odds of a cut June 12 have fallen to 66% after rising to 85% post-FOMC.”
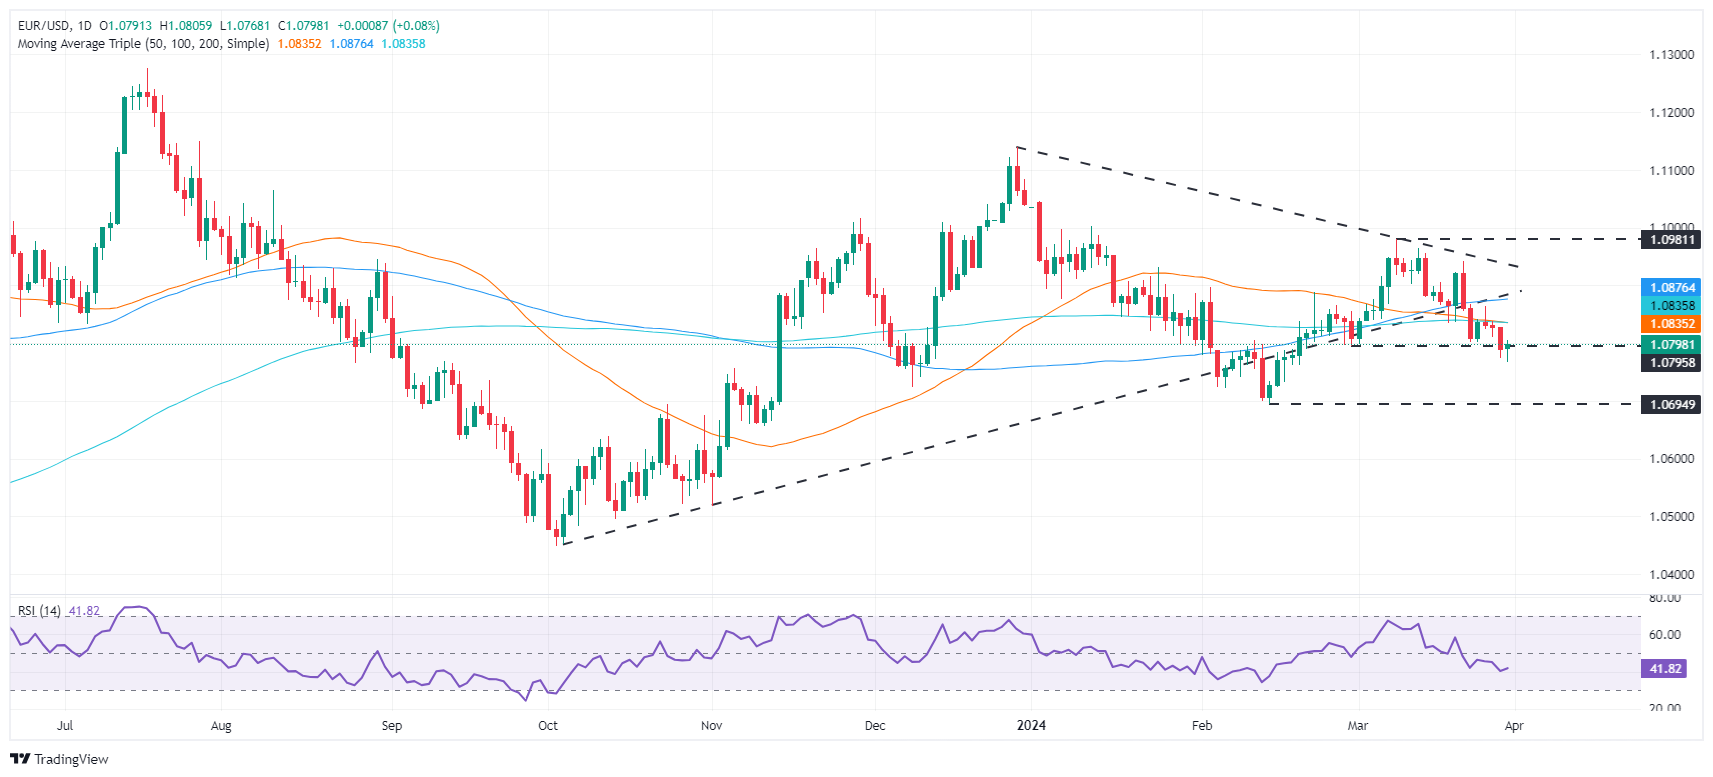
EUR/USD Price Analysis: Technical outlook
During the European session, the pair printed a low of 1.0767. However, the EUR/USD climbed above 1.0790 following the data release, with traders eyeing 1.0800. A decisive break will expose the March 28 high of 1.0827, followed by the 50-day moving average (DMA) at 1.0834, ahead of 1.0835, the 200-DMA. Once those levels are cleared, up next would be the 100-DMA at 1.0876. On the other hand, further losses are eyed below 1.0750, which would expose the February 14 low of 1.0694.
(Click on image to enlarge)
EUR/USD
| OVERVIEW | |
|---|---|
| Today last price | 1.0798 |
| Today Daily Change | 0.0009 |
| Today Daily Change % | 0.08 |
| Today daily open | 1.0789 |
| TRENDS | |
|---|---|
| Daily SMA20 | 1.0876 |
| Daily SMA50 | 1.0837 |
| Daily SMA100 | 1.0875 |
| Daily SMA200 | 1.0836 |
| LEVELS | |
|---|---|
| Previous Daily High | 1.0828 |
| Previous Daily Low | 1.0775 |
| Previous Weekly High | 1.0942 |
| Previous Weekly Low | 1.0802 |
| Previous Monthly High | 1.0898 |
| Previous Monthly Low | 1.0695 |
| Daily Fibonacci 38.2% | 1.0795 |
| Daily Fibonacci 61.8% | 1.0808 |
| Daily Pivot Point S1 | 1.0767 |
| Daily Pivot Point S2 | 1.0745 |
| Daily Pivot Point S3 | 1.0714 |
| Daily Pivot Point R1 | 1.082 |
| Daily Pivot Point R2 | 1.0851 |
| Daily Pivot Point R3 | 1.0873 |
More By This Author:
USD/JPY Stalls Amid Mixed Market Mood, Intervention ConcernsAUD/USD Stands Its Ground Amid US Data, Ahead Of Aussie’s CPI
Gold Failed To Capitalized On Falling Yields Amid US Dollar Rebound


Comments
Log in or sign up to join the conversation.