EUR/USD Forex Signal: Prepares For Another Leg Lower
The EUR/USD pair will likely continue falling as sellers target the key psychological level at 1.0600.
Bearish view
- Sell the EUR/USD pair and set a take-profit at 1.0600.
- Add a stop-loss at 1.0750.
- Timeline: 1-2 days.
Bullish view
- Set a buy-stop at 1.0670 and a take-profit at 1.0750.
- Add a stop-loss at 1.0600.
The EUR/USD exchange rate moved sideways on Monday morning and remained at the lowest level since March. It was trading at 1.0640, much lower than this year’s high of 1.1280.
Interest rates and US government shutdown
The EUR/USD pair has been in a strong bearish trend in the past few weeks. This decline continued last week after the Federal Reserve hawkish decision. In its September meeting, the bank decided to leave rates unchanged between 5.25% and 5.50%. The dot plot pointed to another 0.25% rate increase.
The Fed’s decision differed from that of the European Central Bank (ECB). In its meeting, the bank hiked rates by 0.25% and then pointed to a pause for the remaining part of the year.
Central banks are battling with numerous headwinds. There are signs that inflation is bouncing back, helped by the rising crude oil, olive oil, live cattle, and cocoa prices. Brent was trading at $91.2 on Monday but analysts at JP Morgan believe that it will hit $150 in 2024.
Meanwhile, UAW workers are striking in the US, which will lead to higher vehicle prices. A long traffic jam is happening at the Panama Canal a key shortcut used by American exporters and importers.
At the same time, liquidity in the financial industry is drying up while mortgage rates in the US are nearing 8%. Delinquencies have also risen sharply in the past few months. Therefore, further rate hikes could lead to a recession since the yield curve has inverted to the lowest level in years.
The next key catalyst for the EUR/USD pair will be the developments on US government shutdowns. Most analysts believe that the shutdown will happen on October 1.
EUR/USD technical analysis
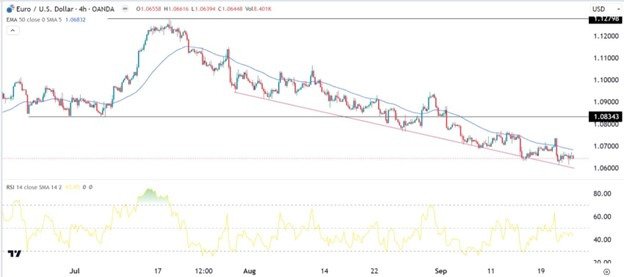
The EUR/USD exchange rate has been in a strong bearish trend in the past few months. It remains slightly above the descending trendline, which connects the lowest swings since July.
Most importantly, the pair has remained below the 50-period moving average and the important resistance at 1.0834 (June and July lows). The Relative Strength Index (RSI) has moved below the neutral point at 50. It has also formed a small bearish flag pattern.
Therefore, the pair will likely continue falling as sellers target the key psychological level at 1.0600.
(Click on image to enlarge)
More By This Author:
WTI Crude Oil: Weekly Forecast For Sept. 25-29Weekly Forex Forecast - Sunday, Sept. 24
GBP/USD: Weekly Forecast 24th September - 30th September
Disclosure: DailyForex will not be held liable for any loss or damage resulting from reliance on the information contained within this website including market news, analysis, trading signals ...
more


