EUR/USD Flip-Flops In A Range Prior To US CPI
EUR/USD is trading in the 1.0850s on Wednesday, little changed from the previous day’s close as traders await key macroeconomic data from the US in the form of the Consumer Price Index (CPI) for March, which will be released at the start of the US session.
EUR/USD could breakout after CPI data
EUR/USD could see a lift in volatility from the CPI data if it deviates significantly from expectations.
Economists estimate that the data will show prices in the US to have risen by 3.4% Year-over-Year in March and 3.7% YoY for core goods, which excludes volatile food and energy prices.
Results in line with expectations would still indicate an inflation rate well above the Federal Reserve’s (Fed) 2.0% target. A greater decline would be required before the Fed is likely to bring down interest rates from their current 5.5% level.
In contrast to the Fed, the European Central Bank (ECB) is seen as more likely to cut interest rates earlier amid more subdued growth and inflation expectations.
For EUR/USD, the maintenance of higher interest rates in the US compared to the Eurozone is a bearish factor. This is because relatively higher interest attracts foreign capital inflows, favoring the US Dollar in this case.
ECB meeting on the horizon
EUR/USD could experience further volatility on Thursday after the European Central Bank (ECB) holds its April policy meeting.
A few ECB members, such as the President of the Banque de France, François Villeroy de Galhau have mentioned April as a possible time for the ECB to implement a first interest-rate cut.
The majority of ECB members, however, think April is too early because the ECB will not yet have the latest wage data at hand, and wage inflation is seen as a critical input into their inflation models and decision-making process.
EUR/USD, however, could still be moved if the language in the accompanying statement suggests a higher probability of the ECB making an interest-rate cut in June.
Technical Analysis: EUR/USD increasingly looking range-bound
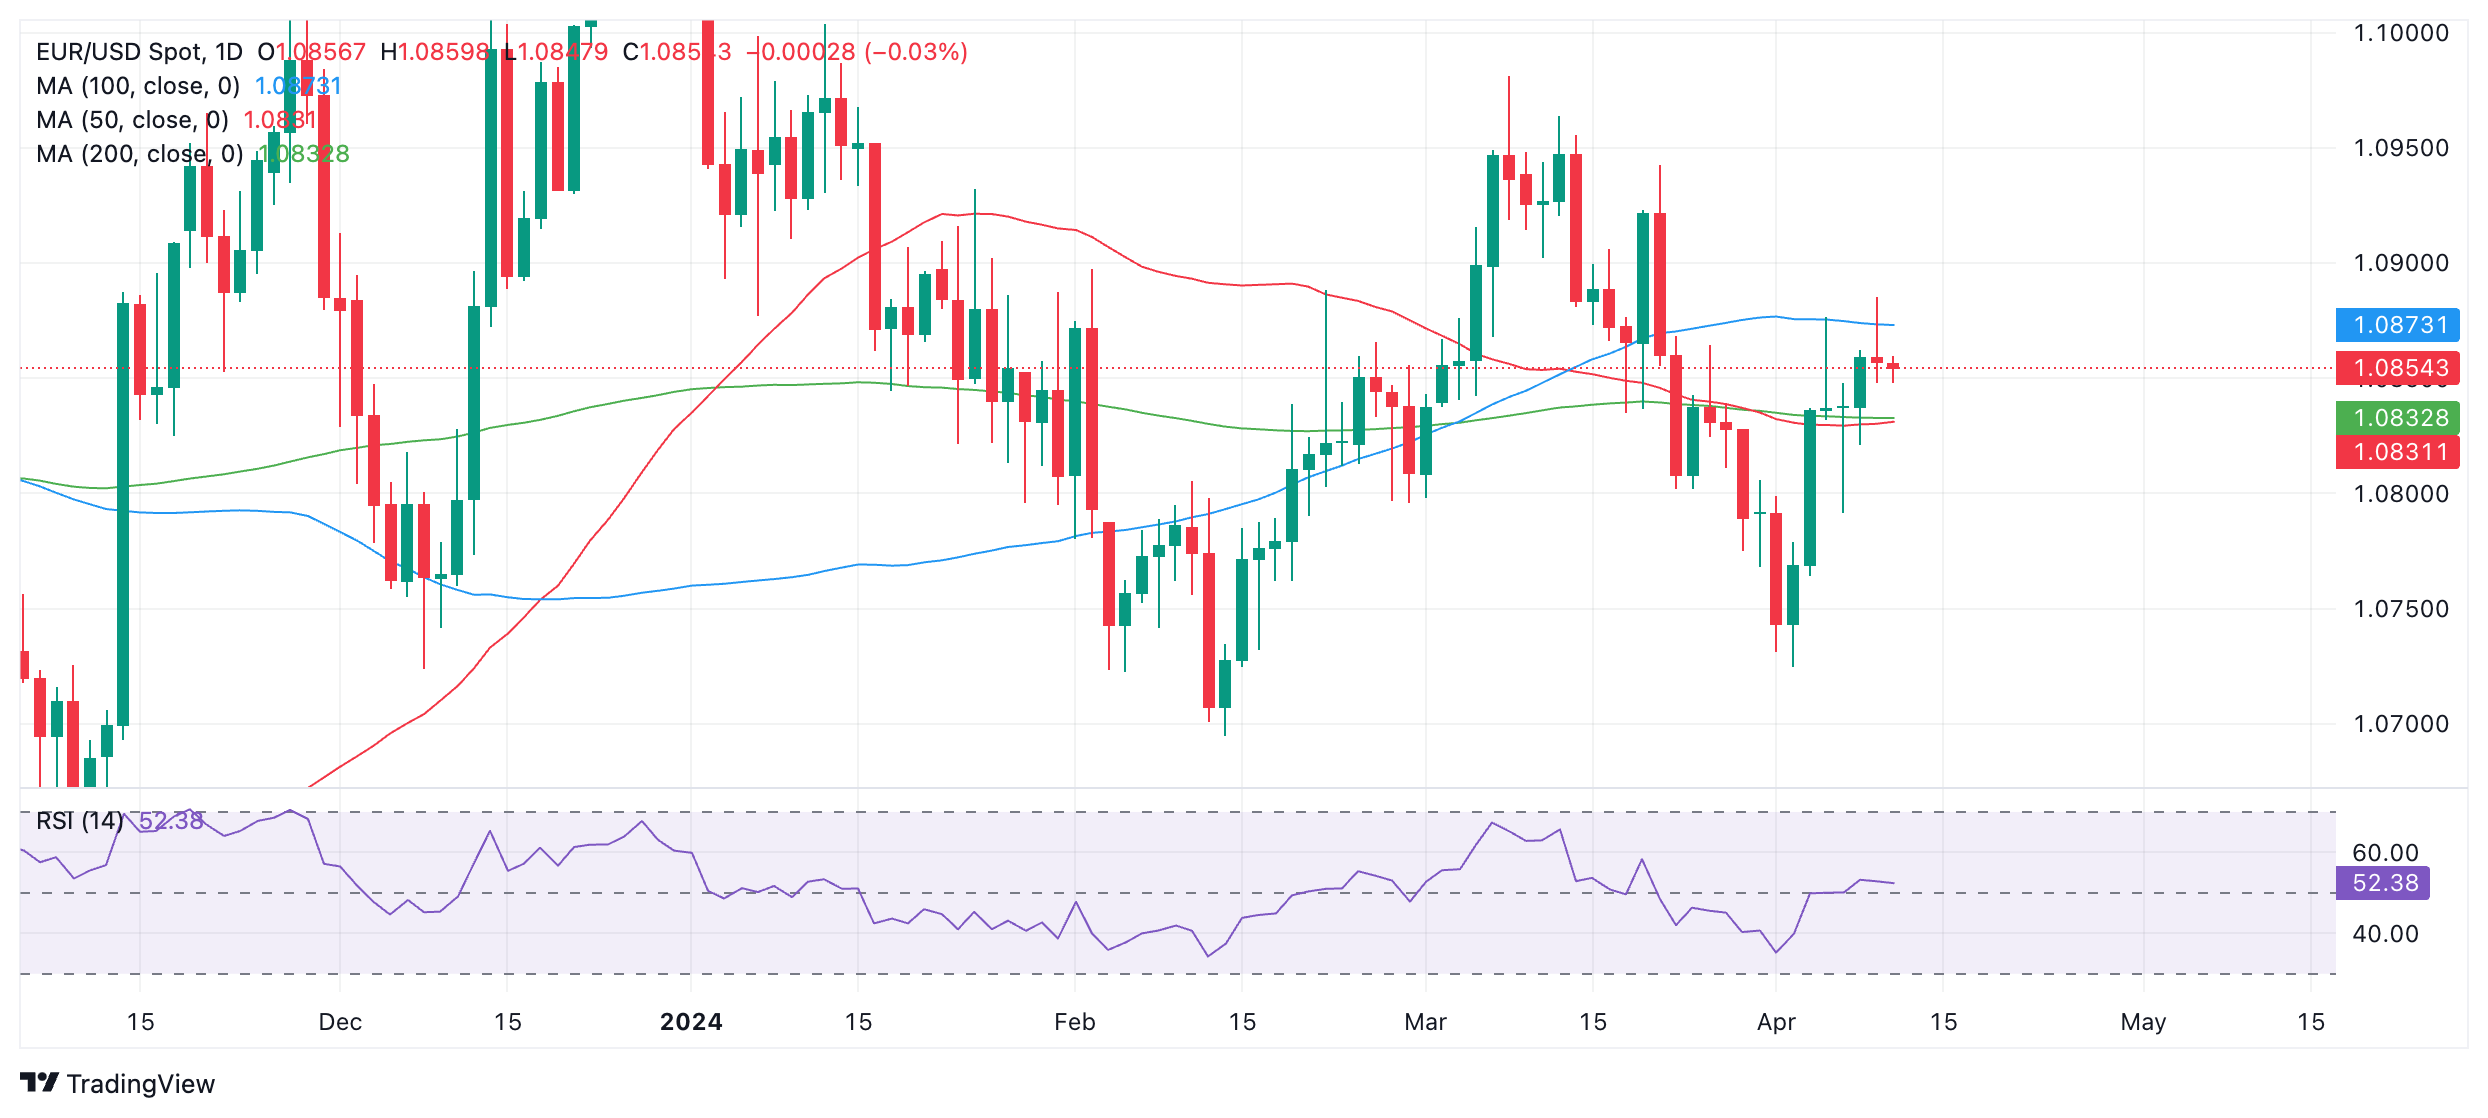
EUR/USD appears trapped within the pincers of three significant Simple Moving Averages (SMA). It seems to be in an overall sideways trend on the 4-hour short-term chart.
The 50-day and 200-day SMAs are providing support at 1.0830 and 1.0831, while the 100-day SMA is acting as a resistance at 1.0873.
EUR/USD Daily Chart
(Click on image to enlarge)
A decisive break above the 100-day SMA could see a rally to perhaps the March 21 high at 1.0942.
Alternatively, a decisive break below the cluster of MAs in the 1,0830s might see a pullback evolve down to support at the April 2 swing lows of 1.0725.
A decisive break below would be characterized by a long red candle penetrating and closing near its low, or three red candles in a row, piercing through the level.
The same would be the case for a decisive break above, except with green candles rather than red.
More By This Author:
USD/JPY Pushes Up To Within Touching Distance Of 152.000, Analysts Bullish
Japanese Yen Remains Confined In A Range Near Multi-Decade Low Against USD
Canadian Dollar Pares Losses As The NFP Dust Settles
Information on these pages contains forward-looking statements that involve risks and uncertainties. Markets and instruments profiled on this page are for informational purposes only and should not ...
more


