
The EUR/GBP pair drops slightly to 0.8550 in the European session on Monday as investors remain uncertain when the European Central Bank (ECB) and the Bank of England (BoE) will begin cutting interest rates.
The Eurozone’s preliminary inflation data for February, released on Friday, showed that annual core inflation data, which excludes volatile items such as food and oil prices, grew at a higher pace of 3.1% against expectations of 2.9% but the pace was lower than January’s reading of 3.3%. The monthly core inflation data rose 0.7% after deflating 0.9% in January. This has deepened uncertainty over the timing of rate cuts by the ECB.
Meanwhile, higher inflation in the United Kingdom economy indicates that the BoE will cut interest rates later than the ECB. The UK’s inflation is highest in the Group of Seven economies (G-7), forcing BoE policymakers to hold interest rates in the restrictive territory for a longer period.
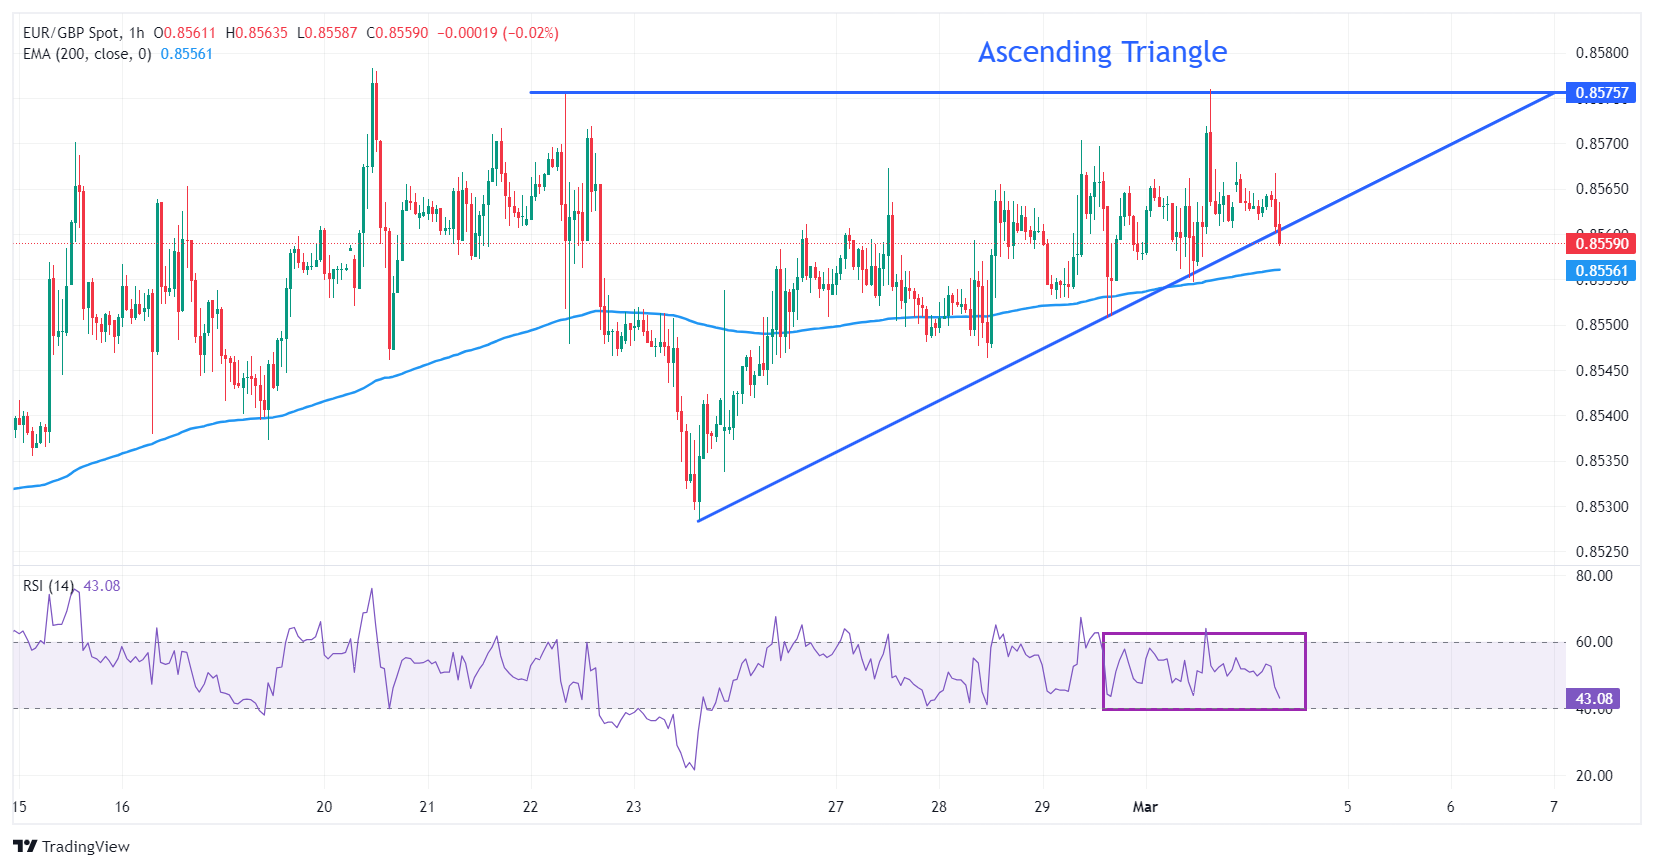
EUR/GBP hovers near the upward-sloping border of the Ascending Triangle pattern formed on an hourly timeframe, plotted from February 23 low at 0.8529. The horizontal resistance of the aforementioned chart pattern is placed from February 22 high at 0.8576.
An Ascending Triangle pattern exhibits indecisiveness among market participants but with a slight upside bias due to higher lows and flat highs.
The 14-period Relative Strength Index (RSI) oscillates in the 40.00-60.00 range, indicating a sharp volatility contraction.
Fresh upside would appear if the asset breaks above February 22 high at 0.8576, driving the asset towards the round-level resistance of 0.8600, followed by January 16 high near 0.8620.
On the contrary, the appeal for the asset weakens if it drops below February 19 low at 0.8537. This would drag the asset towards February 7 low at 0.8516 and the psychological support of 0.8500.
EUR/GBP hourly chart
(Click on image to enlarge)
EUR/GBP
| OVERVIEW | |
|---|---|
| Today last price | 0.8559 |
| Today Daily Change | -0.0004 |
| Today Daily Change % | -0.05 |
| Today daily open | 0.8563 |
| TRENDS | |
|---|---|
| Daily SMA20 | 0.8548 |
| Daily SMA50 | 0.8577 |
| Daily SMA100 | 0.8624 |
| Daily SMA200 | 0.8611 |
| LEVELS | |
|---|---|
| Previous Daily High | 0.8576 |
| Previous Daily Low | 0.8555 |
| Previous Weekly High | 0.8576 |
| Previous Weekly Low | 0.8534 |
| Previous Monthly High | 0.8578 |
| Previous Monthly Low | 0.8498 |
| Daily Fibonacci 38.2% | 0.8568 |
| Daily Fibonacci 61.8% | 0.8563 |
| Daily Pivot Point S1 | 0.8553 |
| Daily Pivot Point S2 | 0.8543 |
| Daily Pivot Point S3 | 0.8532 |
| Daily Pivot Point R1 | 0.8574 |
| Daily Pivot Point R2 | 0.8586 |
| Daily Pivot Point R3 | 0.8596 |
More By This Author:
USD/CHF Price Analysis: Rises To 0.8850 On Firmer US DollarUSD/CAD Price Analysis: Consolidates Below 1.3600 Ahead Of US Core PCE, Canadian Q4 GDP


Comments
Log in or sign up to join the conversation.