
Escalating Prices Keep The Inflation Gauge High

I hope your week went well and you are in a position to enjoy the extended weekend with the upcoming Presidents' Day on Monday (markets are closed). Let’s get the very important updates out of the way.
Congratulations to our readers and friends who were rooting for the Kansas City Chiefs and their win at last week’s Super Bowl. It was a great game. And congratulations to our own Keith and Mish Schneider, who put a small wager before the season on Kansas City being the ultimate winner. This was prophetic, and I have learned, in my short tenure with them both, you never challenge Mish’s clairvoyance. Let me provide an example.
In the fall of 2021, Mish had one of her earliest appearances with Charles Payne on Fox Business News. She told Charles on that show that we were facing stagflation. This partially emanated because she understands how the economy works better than most, and she remembers what it looked like in the late 1970’s.
Back in 2021, virtually nobody was using the term stagflation. Now, you hear this term everywhere. Mish was very prescient back then, predicting that we were going to experience higher inflation for a longer period of time. She also suggested that when we all thought it was dropping (as it has been the past six months), it might flare up and then persist for a much longer period of time.
As we have described below, we believe that this past week demonstrated such a flare up. And it is likely to continue (especially if energy prices go back up).
The Inflation Indicators - The CPI and PPI
This past week, both indicators were released. Analysts and the “market” had less trepidation given that the most recent months have seen a significant decrease in both the Consumer Price Index as well as the Producer Price Index (the latter being more about finished goods).
Surprise, both numbers came in hotter than expected.
Let’s begin with the most recent release on Thursday of the Producer Price Index (PPI). This was expected to come in at 0.5% and year-over-year at 5.9%. The numbers, however, came in higher at 0.7% and 6.0% year-over-year, respectively. This was a surprise to economists and to the market.
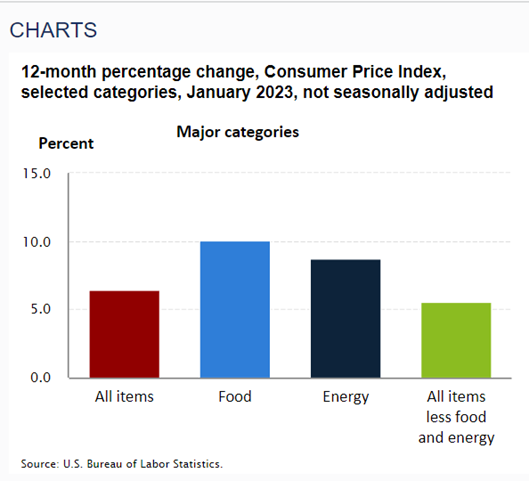
Last Tuesday (Valentine’s Day), the CPI was expected to come in at 0.4% for the month of January and 6.3% year-over-year. Instead, the number for January 2023 came in at 0.5% and 6.4% for 12 months (year-over-year), respectively. Food and energy also remained elevated.
Both the PPI and CPI numbers are not dropping as much as people had expected. And this is after the government has been hard at work massaging the way the monthly numbers are calculated.
With all candor, there are two realities that one must understand:
- They are calculating the number using new methods. In truth, the rate of inflation is probably well over 8%.
- These past 12-month numbers are on top of a previous twelve-month number of greater than 8%. So in reality, we have seen at least 15%-20% inflation over the past two or more years. That is why everything seems so expensive. Food costs have likely tripled from pre-pandemic levels.
To get a better idea of how each input is contributing to the overall rate of inflation, one must look under the hood. You may notice that the two highest contributors and several in the top 10 list are all food-related.

What Effect is This Having?
For one, we all continue to suffer through much higher prices. It was reported this week that 64% of all Americans are living paycheck to paycheck. Lines at food banks and charity organizations have grown, with some food giveaway programs unable to fulfill demand.
One of the largest negative effects has been the huge growth in part-time employment, which we have discussed in detail recently. Based on the numbers we have previously presented, approximately 1.4 million part-time jobs have been created since the beginning of 2022. Virtually no full-time employment has been added during that same period of time.
Bond rates are rising. Look for the Federal Reserve to keep rates higher for longer. Since the beginning of December 2022, this has been our mantra. This week, the 10-year bonds sold off, and yields climbed higher. We also discussed this in last week’s column.
This has had a negative effect on the stock market, as the S&P experienced its second negative week in a row. The issue right now is that the 10-year yield is sitting at the highs of its recent channel (3.3%-3.9%), and if rates climb above the 3.9% area, the 10-year could easily head back up over 4.0%.

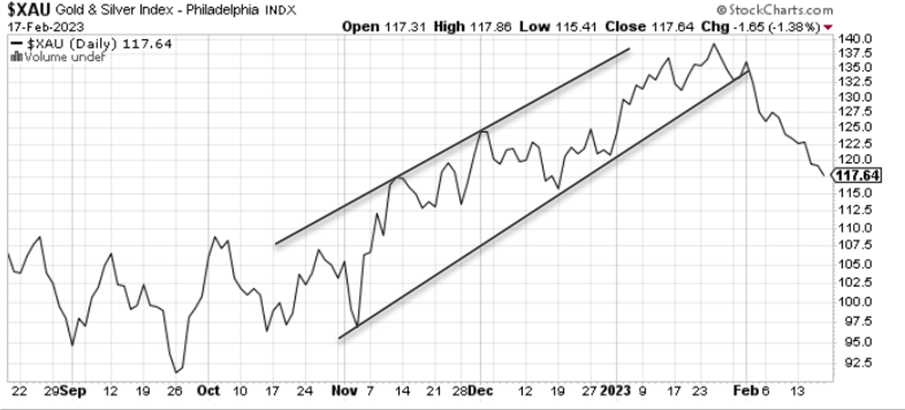
Rising rates have also been a positive for the US dollar as it has recently gained strength. This has put pressure on silver, gold, and the metals markets (gold miners). If the dollar strength continues, this might be another headwind (as it was during 2022) on the stock market. Large multi-nationals prefer a weaker US dollar, as it increases their overseas earnings with a positive US dollar conversion.
As many of you know who follow Mish and/or our ETF rotation models, we have been bullish on the metals during parts of 2022 and so far in 2023. We remain so, especially given our belief that eventually, the Treasury and Federal Reserve will become more accommodative and start the printing presses yet again. This would be very bullish for silver and gold.
However, in the near-term, gold and silver are going through a correction. Mostly as a result of the recent US dollar strength.
One of The Ways to Play the Rising Cost of Food
As noted below, we are closely watching DBA, the futures based ETF that offers investors a way to play rising agricultural costs. While this ETF has been range-bound since hitting highs in 2022, it could be setting up for another leg higher.
This has been an ETF and a thesis that Mish has discussed in her national media appearances consistently since 2021. Her followers have profited several times from her suggestions of taking a position.

A 30 cent move higher would be considered a “new” breakout. This might lead to a move back up to $22 or higher. Watch for this type of price action. Here are the components that make up the DBA ETF. Notice that since future contracts are used, the ETF has to sit in 40% or more of cash (or cash equivalents) to have the collateral for the highly leveraged futures contracts.

Note that sugar is one of the top components. Mish frequently talks about when people are struggling to make ends meet in the economy, sugar often spikes. This is a function of people lowering their preferences and demand for higher quality food (non-affordability factor) and/or reaching for more sugar-based products for comfort type substitutes (candy, alcohol, and desserts).
Inflation is Persistent
We have commented for over a year now that inflation is a punishing and insidious hardship on all people on our planet, not just Americans. We have commented that it will be around longer than people expect. Now it is beginning to get the media’s attention more and more. The Economist’s recent cover article was about how hard it is to bring down.
In the 1970's, it lasted for over eight years. The stock market was range-bound during that time. Clearly, given that economic books are full of the negative nature of inflation, one might have thought the Federal Reserve would have learned from history how difficult it is to bring down.

Since last October, many analysts, economists, media heads, and especially our government have all been broadcasting that the Fed’s going to pivot (stop raising rates), and inflation will come down fast. They also extrapolate the numbers and figure if we brought inflation down from 9% to 6% during 2022, then we should be at the Fed’s target of 2% in no time at all. I don’t believe them.
Where Are We in the Stock Market?
We have started the year off in a positive fashion. In previous articles, we have provided the statistics of what might happen in the remainder of the year after a positive January trifecta. We offer another positive perspective from a chart that was published just this week.

Also, recently, small- and mid-cap stocks have performed better than the S&P 500 on an equal-weighted (not cap-weighted) basis.

This is good news, especially in light of higher borrowing costs which typically burden small and mid-sized companies more than their larger counterparts.
There was a great chart this week also showing the critical area we now find the S&P 500 index sitting at. Add this chart to the information presented here on inflation, the US dollar, and rising interest rates, and it adds up to the fact that we may be in a precarious place in the market right now.

Last, it is important to note, as we have suggested previously, that the latter half of February is typically more negative for the stock market.

Here are the rest of this week’s takeaways.
Risk-On
- All 4 key US indices are still within their respective trading ranges that have been established over the past month. However, 3 of the 4 (excluding QQQ) remain in a bullish phase.
- Retail (XRT) is the top performing sector this week, followed by consumer discretionary (XLY), a strangely positive read that may indicate the expectations of a recession are receding.
- The number of stocks within the Russel 2000 index that are above their respective 10-day moving averages continues to improve. However, the S&P 500 appears to be lagging, indicating outperformance in small-caps.
- Copper (COPX) continues to consolidate in the same range it was in last week, and it has support above its 50-day moving average for the time being.
- Gold (GLD) has broken down and closed in a warning phase on a daily timeframe, and it is looking to potentially find support at its 50-week moving average.
Neutral
- Volume patterns for the key indices have continued to fall to neutral levels. The exception is the S&P 500, which has had four distribution days over the past two weeks. IWM appears set to continue outpacing the others based on its volume.
- The biggest theme in the market this week was a breakdown across the energy industry, giving back the gains that were achieved just last week.
- Risk gauges have backed off to a neutral reading after sustaining a full risk-on level for the past two weeks.
- The volatility ratio continues to compress, and it indicates the likelihood of a sudden move in equity markets.
- Bonds (BND) put in a bullish engulfing pattern to end the week on Friday that was nearly mimicked across the entire yield curve. This was taking place during a bearish market phase.
- Growth (VUG) is barely hanging onto its lead over value (VTV) and, our triple play indicator shows that this ratio is on the cusp of flipping.
- Large-cap foreign equities (EFA) continued to hold up well. However, emerging markets (EEM) are much weaker, as they’ve now closed below their 50-day moving average as well as the 50-week moving average.
- While the US dollar has now cleared its 50-day moving average, it still has resistance at its longer-term 50-week moving average.
Risk-Off
- The McClellan Oscillator remains in negative territory for the S&P 500 and the Nasdaq Composite.
- The new high/new low ratio is beginning to rollover for the S&P 500. However, it has already begun to deteriorate quite rapidly for the Nasdaq Composite.
- Soft commodities may be the most interesting chart this week, with a close above the 200-day moving average and a higher high than the failed attempt to clear this level from earlier in the week.
More By This Author:
Elevated Risk - What Might Cause Market Weakness?
Good News! Or Is It? Let's Take A Closer Look
The Bull is Awake, But Will it Continue?
Our advice: stay connected with these weekly updates, stay tuned with our risk gauges, and consider using one of the MGAM dynamic portfolio blends to help supplement your overall investing strategy. ...
more

