
Empire State Manufacturing Survey: Continued Growth In January
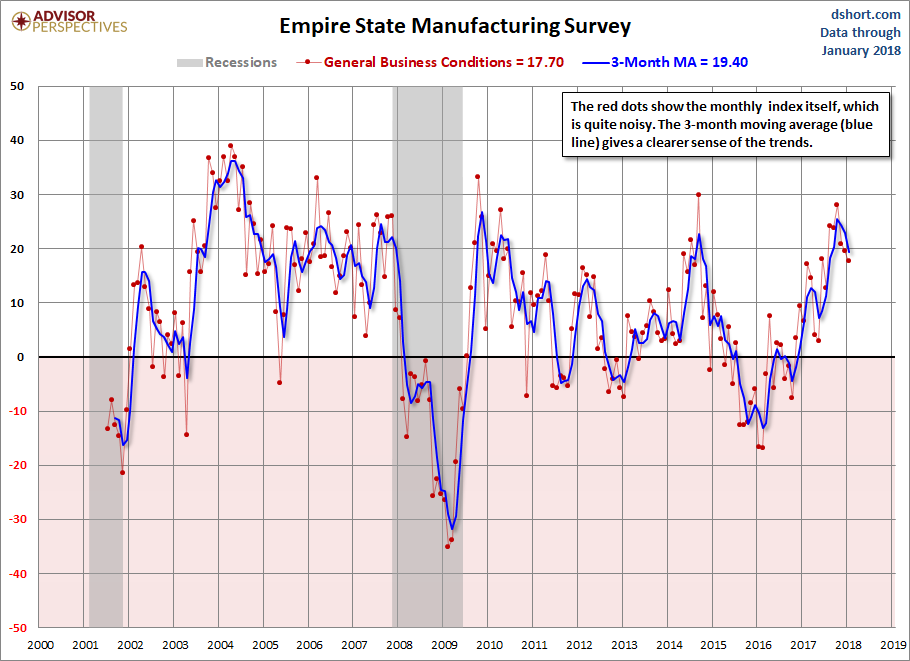
This morning we got the latest Empire State Manufacturing Survey. The diffusion index for General Business Conditions at 17.7 was a decrease of 1.9 from the previous month's 19.6. Annual benchmark revisions were made.
The Investing.com forecast was for a reading of 18.0.
The Empire State Manufacturing Index rates the relative level of general business conditions in New York state. A level above 0.0 indicates improving conditions, below indicates worsening conditions. The reading is compiled from a survey of about 200 manufacturers in New York state.
Here is the opening paragraph from the report.
Business activity continued to grow at a solid clip in New York State, according to firms responding to the January 2018 Empire State Manufacturing Survey. The headline general business conditions index, at 17.7, was little changed from last month’s level. The new orders index and the shipments index both showed ongoing growth, although at a slower pace than in December. Unfilled orders and delivery times increased slightly, and inventory levels were higher. Labor market conditions pointed to a modest increase in employment and steady workweeks. Both input prices and selling prices increased at a faster pace than last month. Firms remained very optimistic about future business conditions, and capital spending plans were robust. [source]
Here is a chart of the current conditions and its 3-month moving average, which helps clarify the trend for this extremely volatile indicator:
Click this link to access a PDF set of charts of the individual components over the past 12 months.
Since this survey only goes back to July of 2001, we only have one complete business cycle with which to evaluate its usefulness as an indicator for the broader economy. Following the Great Recession, the index has slipped into contraction multiple times, as the general trend slowed. 2015 saw a gradual decline that picked up in 2016.
Here is an overlay of the current and future conditions (a six-month outlook). The future conditions index is still optimistic after almost a year into the new administration.

Meanwhile, here's another look at the latest ISM Manufacturing Business Activity Index.

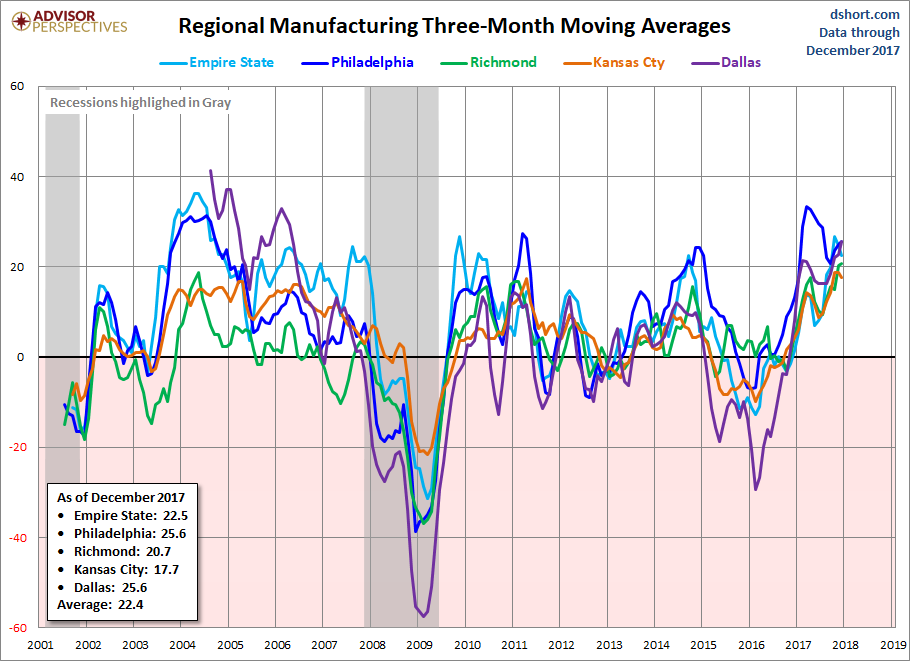
Let's compare all five Regional Manufacturing indicators. Here is a three-month moving average overlay of each since 2001 (for those with data).
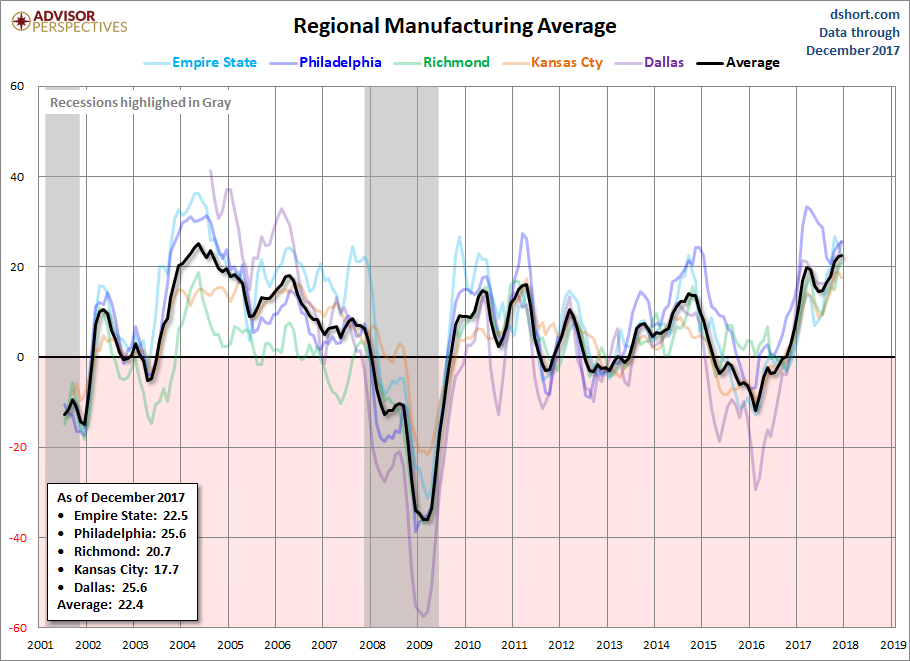
Here is the same chart including the average of the five. Readers will notice the range in expansion and contraction between all regions.
Let's keep a close eye on some of the regional manufacturing indicators in the months ahead.
Disclosure: None.


