
Intuit Inc., Elliott Wave Technical Analysis

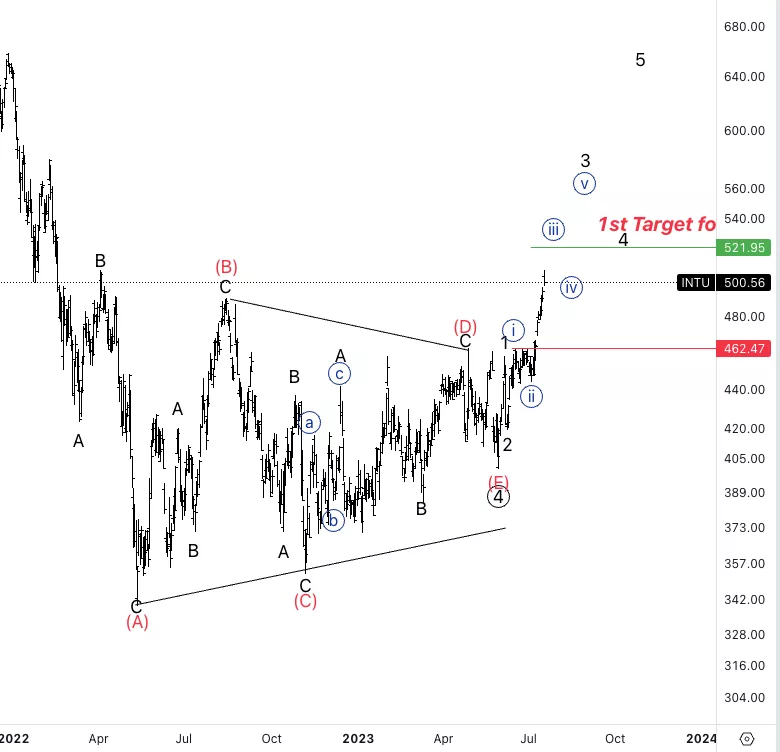
Intuit Inc., (INTU): Daily Chart, Thursday, July 20
INTU Stock Market Analysis: As we keep moving higher the idea that the triangle in wave 4 is finished has been confirmed. At this point we are purely looking for upside resumption. You can see the 1st target for minor wave 3 which could be most likely surpassed.
INTU Elliott Wave Count: 3 of (1).
INTU Technical Indicators: Above all averages.
INTU Trading Strategy: Looking for longs into wave 5.
TradingLounge Analyst: Alessio Barretta
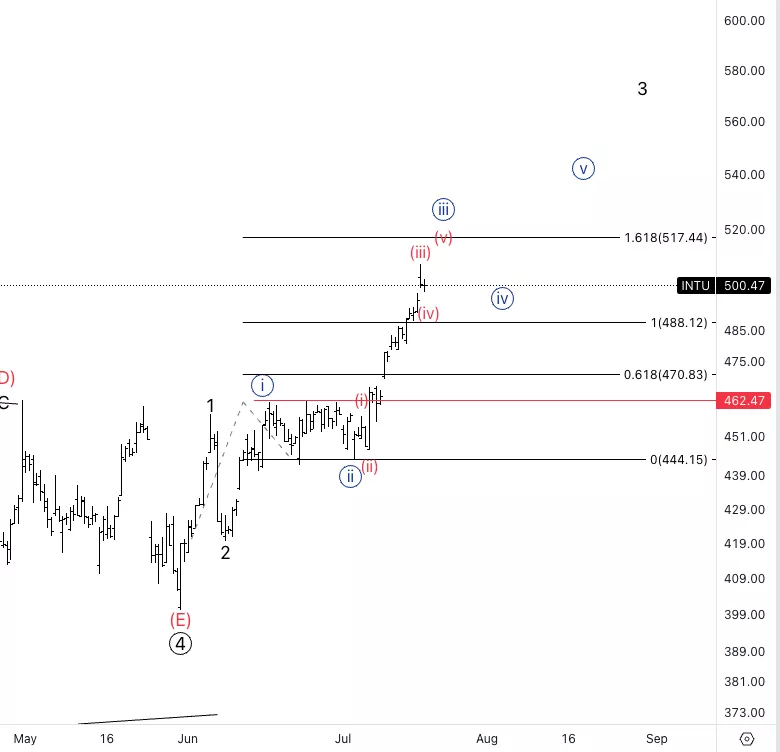
Intuit Inc., INTU: 4-hour Chart, Thursday, July 20
Intuit Inc., Elliott Wave Technical Analysis
INTU Stock Market Analysis: Here’s the subdivision of wave {iii}. Looking for one last leg higher into wave (v) before correct in wave {iv} from which we could be looking for longs.
INTU Elliott Wave count: Wave (iv) of {iii}.
INTU Technical Indicators: Above all averages
INTU Trading Strategy: Looking for longs into wave {v} once we see a bit of a larger pullback in wave {iv}.
More By This Author:
Elliott Wave Technical Analysis: Australian Dollar/U.S. Dollar
Elliott Wave Technical Analysis: DexCom Inc. - Wednesday, July 19
Elliott Wave Technical Analysis: Euro/British Pound


Comments
Log in or sign up to join the conversation.