

Image Source: Unsplash
DexCom Inc., Elliott Wave Technical Analysis
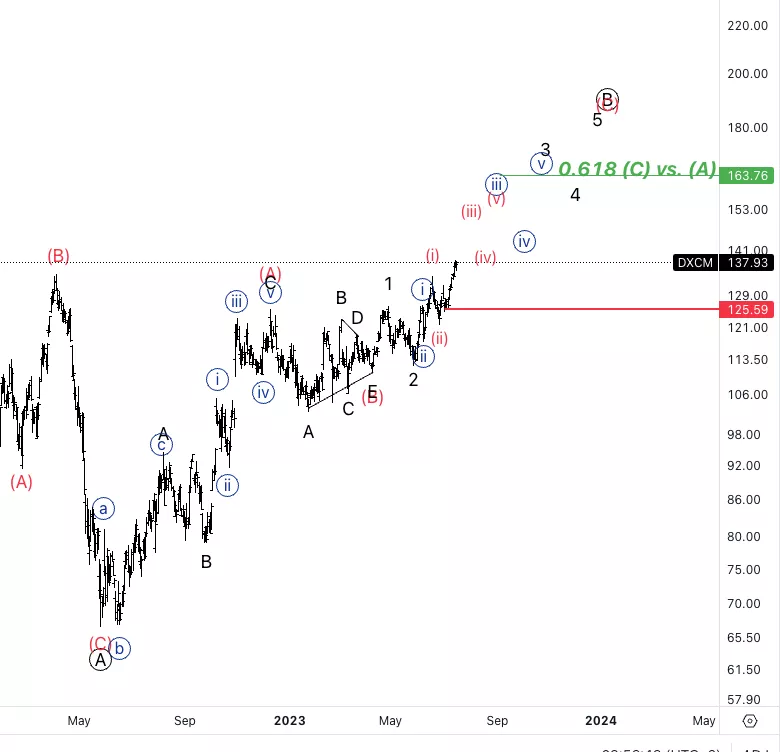
DexCom Inc., (Nasdaq: DXCM): Daily Chart, 19 July 2023
DXCM Stock Market Analysis: We have been moving higher as expected and we seem to be continuing higher into wave 3. Upside target would be at least 163$. If we were to break higher than 163$ we could start to see the whole idea of having wave IV as a flat as we would start to move closer to invalidation level.
DXCM Elliott Wave Count: Wave (C) of B.
DXCM Technical Indicators: Above all averages.
DXCM Trading Strategy: Looking for longs into wave 3.
Analyst: Alessio Barretta
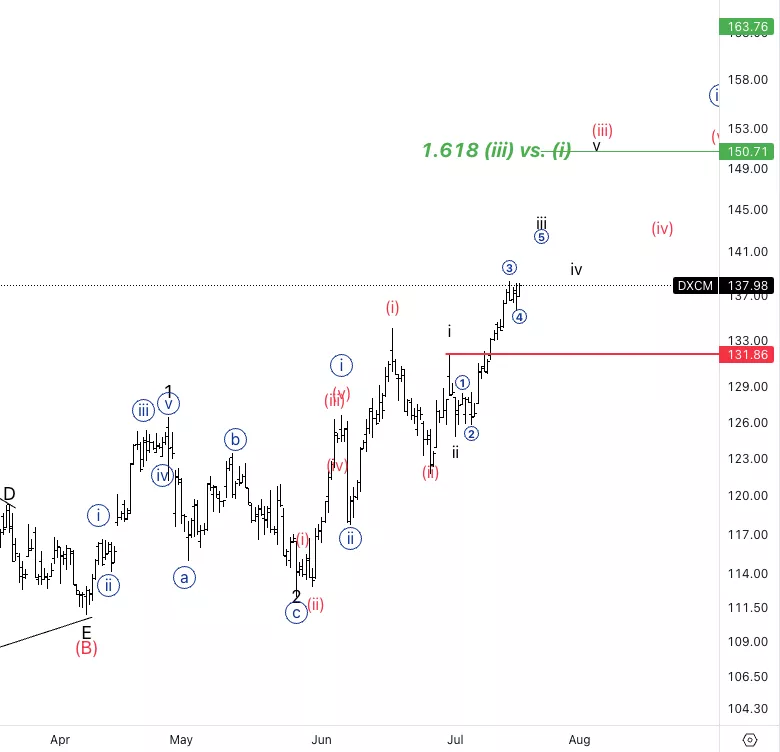
DexCom Inc., DXCM: 4-hour Chart, 19 July 2023
DexCom Inc., Elliott Wave Technical Analysis
DXCM Stock Market Analysis: We are taking a closer look at potential wave 3. Looking for further upside to continue as follow. Invalidation level stands at 131.8$, as we could overall wave iv and i.
DXCM Elliott Wave count: Wave iii of (iii).
DXCM Technical Indicators: Above all averages
DXCM Trading Strategy: Looking for longs on the pullback in wave iv.
More By This Author:
Elliott Wave Technical Analysis: U.S. Dollar/Japanese Yen
Elliott Wave Technical Analysis: Monster Beverage Corp. - Tuesday, July 18
Elliott Wave Technical Analysis: NEO/U.S. Dollar - Tuesday, July 18


Comments
Log in or sign up to join the conversation.