Gold:
Short Term Update:
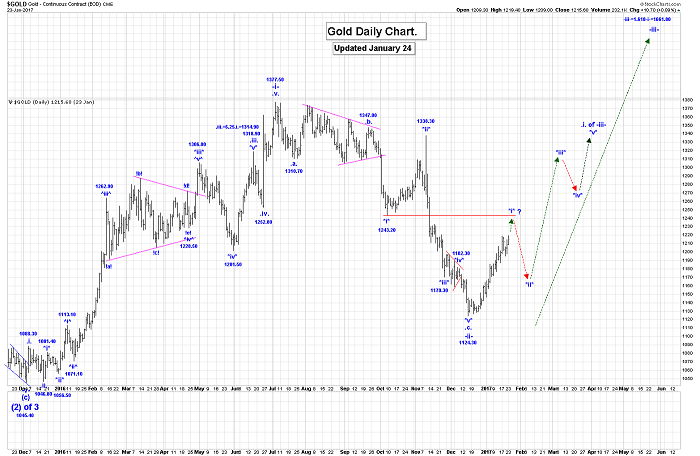
Gold made a marginal new high in yesterday’s day session reaching 1219.50, and in the overnight session we retreated to a low of 1211.00, at the time that this Post was being written.
We still expect further upside within our current wave *i*, although we cannot now rule the possibility at all of wave *i* ended at the 1219.50 high and we are now starting a larger wave *ii* correction.
A break and close above the 1220.00 level should see a quick run to the 1245.00 level, which could mark the end of wave *i*, as shown on the Daily Gold Chart.
Currently on the Intraday Chart the rallies in gold look impulsive and the setbacks corrective which suggest higher prices are still ahead. So far the first impulsive sequence does NOT look complete at the 1219.50 high, but we need to be on guard for end of wave *i* soon, unless it extends. As you can see on the Daily Gold Chart we have shown graphically what the current rally in gold looks like as we are still just working on wave *i* of .i. of -iii-. A run to resistance at the 1244.00 level seems a likely place for wave *i* to end.
Our first and second projections for the end of wave -iii- is :
-iii-=1.618-i-=1661.80;
-iii-=2.618-i-=1993.70.
Our current count for all of wave -iii- is:
.i.:
*i* = 1219.50, if complete;
*ii* correction is next, after wave *i* ends.
When wave *i* ends we should expect wave *ii* to retrace between 50 to 61.8% of the entire wave *i* rally.
Longer Term Update:
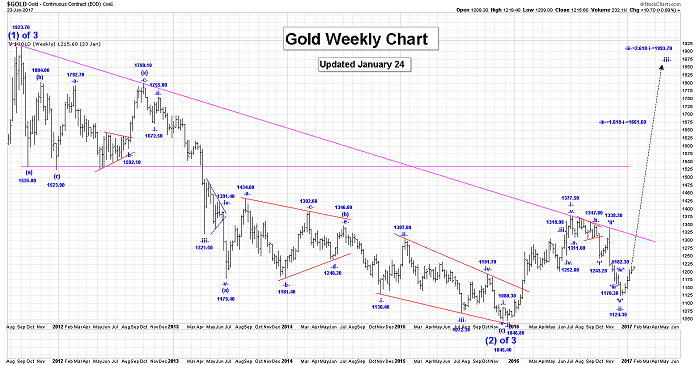
Gold looks to have completed its wave -ii- correction, at the 1124.30 low., and we are now rallying in the early stages of wave -iii-.We have updated the Weekly Gold Chart showing our projections for the end of wave -iii-.
Active Trading Positions: Long 30 positions, with puts at 1250.00!
S&P500:
Short Term Update:
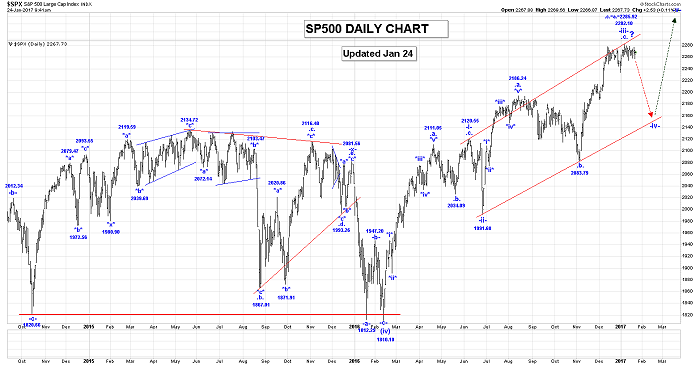
The S&P was generally flat in yesterday’s day session and in the overnight session the S&P Futures are unchanged, at the time that this Post was being written.
The S&P is now within a whisper of our projected end of for all of wave -iii- which is 2285.92, so we need to be on guard for end of the -iii- and the start of significant drop in wave -iv-.
The final top in the S&P is still likely to occur early in 2017.
Long Term Update:
Wave (v) has become a diagonal triangle. We could now be complete all of wave .c. of -iii- at the 2282.10 high. Upon completion of wave -iii-, we expect a wave -iv- drop followed by a wave -v- rally.
Active Trading Positions: Short with 2280 calls as stops!
GDX:
Short Term Update:
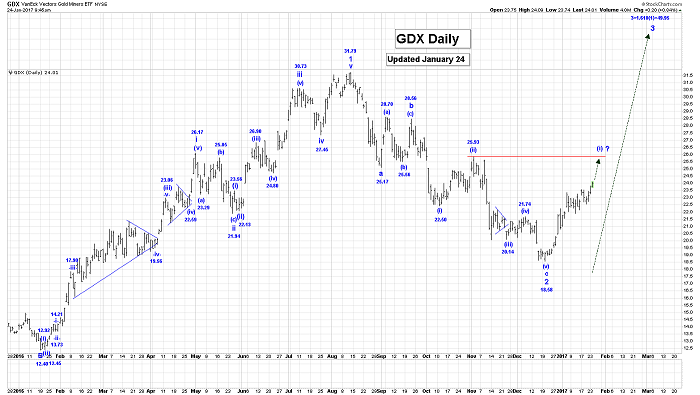
The GDX was higher in yesterday’s trading session and if wave *i* is not complete in gold at the 1219.50 high, then we expect further gains in wave (i), as shown on the Daily GDX Chart.
If wave *i* in gold is complete at the 1218.80 high then wave (i) in the GDX is complete at the 23.56 high and wave (ii) is about to begin. If wave (ii) is underway then we expect that it will retrace between 50 to 61.8% of the entire wave (i) rally. We will start labelling the internal wave structure of wave 3 after our first impulsive sequence ends.
The wave 3 rally in the GDX will likely follow the same graphically picture that we have shown on the Daily Gold Chart. Our first and second projection for end of wave 3 is:
3=1.618(1)=49.95;
3=2.618(1)=68.98
As with gold and silver this wave 3 impulsive sequence will consist of 5 subdivisions.
Long Term Update:
In the GDX, we now believe that all of wave 1 ended at 31.79 and that wave 2 at the 18.68 low also. A sharp wave 3 rally is now underway.
Disclosure: Active Trading Positions: We are long the GDX, ABX, KGC, NEM, CRJ, and TSX:XGD with no stops!
Free Trades ...
more
Disclosure: Active Trading Positions: We are long the GDX, ABX, KGC, NEM, CRJ, and TSX:XGD with no stops!
Free Trades Offer For Web Readers: Send me an email to admin@captainewave.com and I’ll send you my next couple short term ewave trades for free!
Risk: CAPTAINEWAVE.COM IS AN IMPERSONAL ADVISORY SERVICE. AND THEREFORE, NO CONSIDERATION CAN OR IS MADE TOWARD YOUR FINANCIAL CIRCUMSTANCES. ALL MATERIAL PRESENTED WITHIN CAPTAINEWAVE.COM IS NOT TO BE REGARDED AS INVESTMENT ADVICE, BUT FOR GENERAL INFORMATIONAL PURPOSES ONLY. TRADING STOCKS DOES INVOLVE RISK, SO CAUTION MUST ALWAYS BE UTILIZED. WE CANNOT GUARANTEE PROFITS OR FREEDOM FROM LOSS. YOU ASSUME THE ENTIRE COST AND RISK OF ANY TRADING YOU CHOOSE TO UNDERTAKE. YOU ALSO AGREE TO BEAR COMPLETE RESPONSIBILITY FOR YOUR INVESTMENT RESEARCH AND DECISIONS AND ACKNOWLEDGE THAT CAPTAINEWAVE.COM HAS NOT AND WILL NOT MAKE ANY SPECIFIC RECOMMENDATIONS OR GIVE ADVICE TO YOU OR ANY OF ITS CLIENTS UPON WHICH THEY SHOULD RELY. CAPTAINEWAVE.COM SUGGESTS THAT THE CLIENT/MEMBER TEST ALL INFORMATION AND TRADING METHODOLOGIES PROVIDED AT OUR SITE THROUGH PAPER TRADING OR SOME OTHER FORM OF TESTING. CAPTAINEWAVE.COM, ITS OWNERS, OR ITS REPRESENTATIVES ARE NOT REGISTERED AS SECURITIES BROKER-DEALERS OR INVESTMENT ADVISORS EITHER WITH THE U.S. SECURITIES AND EXCHANGE COMMISSION OR WITH ANY STATE SECURITIES REGULATORY AUTHORITY. WE RECOMMEND CONSULTING WITH A REGISTERED INVESTMENT ADVISOR, BROKER-DEALER, AND/OR FINANCIAL ADVISOR. IF YOU CHOOSE TO INVEST WITH OR WITHOUT SEEKING ADVICE FROM SUCH AN ADVISOR OR ENTITY, THEN ANY CONSEQUENCES RESULTING FROM YOUR INVESTMENTS ARE YOUR SOLE RESPONSIBILITY.
ALL INFORMATION POSTED IS BELIEVED TO COME FROM RELIABLE SOURCES. CAPTAINEWAVE.COM DOES NOT WARRANT THE ACCURACY, CORRECTNESS, OR COMPLETENESS OF INFORMATION AVAILABLE FROM ITS SERVICE AND THEREFORE WILL NOT BE LIABLE FOR ANY LOSS INCURRED. DUE TO THE ELECTRONIC NATURE OF THE INTERNET, THE CAPTAINEWAVE.COM WEBSITE, ITS E-MAIL & DISTRIBUTION SERVICES AND ANY OTHER SUCH "ALERTS" COULD FAIL AT ANY GIVEN TIME. CAPTAINEWAVE.COM WILL NOT BE RESPONSIBLE FOR UNAVAILABILITY OF USE OF ITS WEBSITE, NOR UNDELIVERED E-MAILS, OR "ALERTS" DUE TO INTERNET BANDWIDTH PROBLEMS, EQUIPMENT FAILURE, OR ACTS OF GOD. CAPTAINEWAVE.COM DOES NOT WARRANT THAT THE TRANSMISSION OF E-MAILS, OR ANY "ALERT" WILL BE UNINTERRUPTED OR ERROR-FREE. CAPTAINEWAVE.COM WILL NOT BE LIABLE FOR THE ACTS OR OMISSIONS OF ANY THIRD PARTY WITH REGARDS TO CAPTAINEWAVE.COM DELAY OR NON-DELIVERY OF THE CAPTAINEWAVE.COM NIGHTLY EMAILS OR "ALERTS". FURTHER, WE DO NOT RECEIVE ANY FORM OF PAYMENT OR OTHER COMPENSATION FOR PUBLISHING INFORMATION, NEWS, RESEARCH OR ANY OTHER MATERIAL CONCERNING ANY SECURITIES ON OUR SITE OR PUBLISH ANY INFORMATION ON OUR SITE THAT IS INTENDED TO AFFECT OR INFLUENCE THE VALUE OF SECURITIES.
THERE IS NO GUARANTEE PAST PERFORMANCE WILL BE INDICATIVE OF FUTURE RESULTS. NO ASSURANCE CAN BE GIVEN THAT THE RECOMMENDATIONS OF CAPTAINEWAVE.COM WILL BE PROFITABLE OR WILL NOT BE SUBJECT TO LOSSES. ALL CLIENTS SHOULD UNDERSTAND THAT THE RESULTS OF A PARTICULAR PERIOD WILL NOT NECESSARILY BE INDICATIVE OF RESULTS IN FUTURE PERIODS. THE RESULTS LISTED AT THIS WEBSITE ARE BASED ON HYPOTHETICAL TRADES. PLAINLY SPEAKING, THESE TRADES WERE NOT ACTUALLY EXECUTED. HYPOTHETICAL OR SIMULATED PERFORMANCE RESULTS HAVE CERTAIN INHERENT LIMITATIONS. UNLIKE AN ACTUAL PERFORMANCE RECORD, SIMULATED TRADES DO NOT REPRESENT ACTUAL TRADING. ALSO, SINCE THE TRADES HAVE NOT ACTUALLY BEEN EXECUTED, THE RESULTS MAY HAVE OVER OR UNDER COMPENSATED FOR THE IMPACT, IF ANY, OF CERTAIN MARKET FACTORS SUCH AS LACK OF LIQUIDITY. YOU MAY HAVE DONE BETTER OR WORSE THAN THE RESULTS PORTRAYED. NO REPRESENTATION IS BEING MADE THAT ANY ACCOUNT WILL OR IS LIKELY TO ACHIEVE PROFITS OR LOSSES SIMILAR TO THOSE SHOWN. NO INDEPENDENT PARTY HAS AUDITED THE HYPOTHETICAL PERFORMANCE CONTAINED AT THIS WEBSITE, NOR HAS ANY INDEPENDENT PARTY UNDERTAKEN TO CONFIRM THAT THEY REFLECT THE TRADING METHOD UNDER THE ASSUMPTIONS OR CONDITIONS SPECIFIED HEREAFTER. WHILE THE RESULTS PRESENTED AT THIS WEBSITE ARE BASED UPON CERTAIN ASSUMPTIONS BELIEVED TO REFLECT ACTUAL TRADING CONDITIONS, THESE ASSUMPTIONS MAY NOT INCLUDE ALL VARIABLES THAT WILL AFFECT, OR HAVE IN THE PAST AFFECTED, THE EXECUTION OF TRADES INDICATED BY CAPTAINEWAVE.COM. THE HYPOTHETICAL RESULTS ON THIS WEBSITE ARE BASED ON THE ASSUMPTION THAT THE CLIENT BUY AND SELLS THE POSITIONS AT THE OPEN PRICE OF THE STOCK. THE SIMULATION ASSUMES PURCHASE AND SALE PRICES BELIEVED TO BE ATTAINABLE. IN ACTUAL TRADING, PRICES RECEIVED MAY OR MAY NOT BE THE SAME AS THE ASSUMED ORDER PRICES.
less
How did you like this article? Let us know so we can better customize your reading experience.


Thanks for sharing