

Image Source: Pexels
The US stock market turned sharply in the last few days following weak US economic data. Looking at the S&P 500, the price moved out of an upward channel which is an important warning signal, suggesting a more complex correction is unfolding and that pause on stocks will be a bit longer, so I think that more weakness can follow after a relief rally.
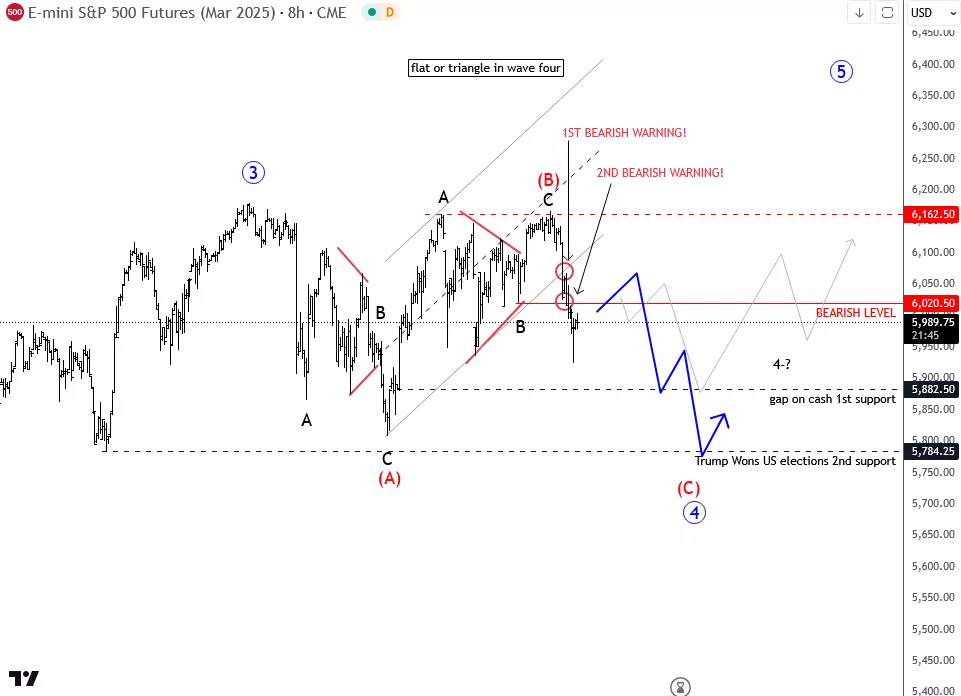
At this stage, we remain neutral on US stock indexes, but based on Elliott wave analysis, I see a chance for further short-term weakness after a relief rally. The current pattern on the illustrated chart below suggests a potential ongoing flat correction, meaning the price could even drop toward 5800, which is a key support level, especially considering that 5784 was the swing low after Trump won the US election in November 2024. So plenty of stops can be around that price and massive liquidation “would help” to stabilize the move. As an alternate scenario support can be already near 5880 if possibly that gap on cash market will be filled and causes a bounce. Then a triangle in the fourth wave is also on the table.
But overall, we see S&P 500 in a correction and that still bulls can return and start progressing even before summer.
(Click on image to enlarge)
More By This Author:
Litecoin Is Acting Strongly, Pointing Higher For A New Five-Wave Bullish Cycle
Elliott Wave On DAX: Price Finally Takes A Breather?
Canaan Points Higher Within An Impulse That Can Extend The Rally For Bitcoin


Comments
Log in or sign up to join the conversation.