Economy And Inflation: Playing It Straight
Sure, I am the guy with indicators called the 3 Amigos and in the future, the 4 Horsemen. I am the guy who for 17+ years has been making up catch phrases for indicators and market backdrops alike (ex. 30yr T bond Continuum, Armageddon ’08 and the Fiscal Cliff Kabuki Dance, etc.) entertaining, pissing off and confusing people, and maybe along the way doing some teaching too.
Currently, we have the happy-go-lucky Amigos (SPX vs. Gold, 10yr/30yr Yields & the Flattening Yield Curve) front and center as they ride toward their destinations, the end of the journey to which would begin to change the macro. We also have a supremely sensitive proprietary indicator being used in NFTRH to significantly fine-tune the process of interpreting changes to the current cycle. You’ve gotta come at the macro from as many rational angles as possible if you want to minimize its confusing aspects.
But the angle I want to come at it from today is linear and normal, having to do with standard economic data and inflation. Tomorrow is the climax to a week that was full of inputs, from the Trump SotU love-in to the FOMC punt, with a nod to increased inflation concern.
I thought that little hawkish tweak in inflation wording in yesterday’s FOMC release was pretty slick of Janet Yellen, as if something changed since the last meeting (NFTRH.com has been on the higher long-term yields theme for months now, after all, and Treasury yields – from 2s to 10s and lately, 30s – should drive Fed Funds policy). So Yellen gets to ride away with everything intact and a little ‘don’t say I didn’t tell you so’ marker about inflation for the record.
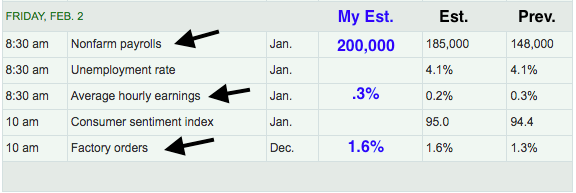
By way of MarketWatch (my markups) here is tomorrow’s data slate…

So where is the inflation-fueled economy at currently by the data most commonly used by conventional analysts and financial media? Well, aren’t my estimates just bright and cheery about December? Q4 was a strong end to a strong year. All of the stuff above is relatively backward looking. It’s the stuff that the media and by extension, the herd will focus upon. And they will as always be late.
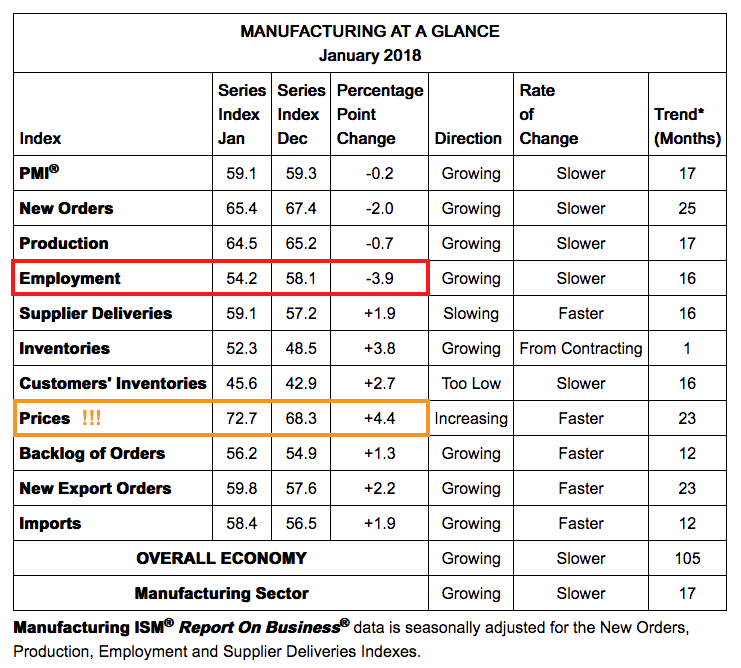
But I did title the article “playing it straight” so let’s do that and continue on with conventional data. December is likely to have been firm. But what is going on under the hood of the manufacturing sector based on today’s ISM report? Let’s take a look.
Manufacturing activity was fine in January as New Orders eased a bit and PMI barely budged. However, the ‘inflation effects’ component, prices, lurched higher. At the same time Employment eased more than just a teeny. That is a concern because…

…based on my experience in manufacturing when materials like these start increasing in price, people start having their wages compacted or start getting shown the door.

I am not trying to be a doomsayer or to bash the Trump miracle. I am simply saying that there is nothing new under the sun and this fiscal reflator/inflator is playing to an old script, wooing the inflation genie. We could still be in early days, but that is why we have Amigo #2‘s ‘limiter’, which is the (red dashed) line between a failure of the inflated aspects of the economy (Trump’s unspoken goal of reflation) or the dropping of the economic pretense that this is of anything other than balls-out inflationary policy, first monetarily by the Fed and now fiscally by the Trump administration.

Rockstar financial personalities like Bill Gross and Ray Dalio have already proclaimed a bond bear market (i.e. that the 30yr yield above is bullish) but as you can see, nothing could be further from the actual case. A breakout above the line could usher in a full frontal von Mises style Crack Up Boom but I think it is more likely that the yield fails again, along with the economy and along with the most recent bout of inflation, which has been with us since 2009 in one form or another and most dynamically in US and many global stock markets.
When projecting yields as likely to fail at the limiter it is important to keep in mind that said projector has been bullish on yields since well before the herd, led by Bill Gross and friends, showed up. I am seeing that rising yield view get more and more crowded and that has been the plan all along. This context is needed because readers need to know that the work is the product of real analysis, not bias.
Let’s see how the Payrolls report shakes out in the morning. Our play is and has been rising Treasury yields toward or to Amigo #2‘s ‘limiters’ of 2.9% on the 10yr and 3.3% on the 30yr shown above. At this point, however, the back-looking data like Payrolls and manufacturing are simply telling us what has been. Considering the junctures of indicators (like the Treasury continuum above) we have noted again and again publicly and some I am keeping close to the vest for NFTRH subscribers, it is time to be looking very closely at forward indications while respecting what is currently in play as indicated by the back-looking stuff.
As I said, look at things from multiple angles and don’t go on autopilot like 90% of the herd. That would be my recommendation, at least.
Subscribe to NFTRH Premium for your 40-55 page weekly report, interim updates and NFTRH+ chart and trade ideas ...
more


Nice job, Gary.
Thank you!