
Durable Goods Again Soft In January 2014
The headlines say the durable goods new orders declined in January – headline growth is down 3 of the last 4 months. Most sectors were soft lead by a weak civilian aircraft sector.

Econintersect Analysis:
- unadjusted new orders growth accelerated 1.2% month-over-month , and is up 2.4% year-over-year
- the three month rolling average for unadjusted new orders decelerated 1.1% month-over-month, and up 4.5% year-over-year.
Year-over-Year Change of 3 Month Rolling Average – Unadjusted (blue line) and Inflation Adjusted (red line)

- Inflation adjusted but otherwise unadjusted new orders are up 1.8% year-over-year.
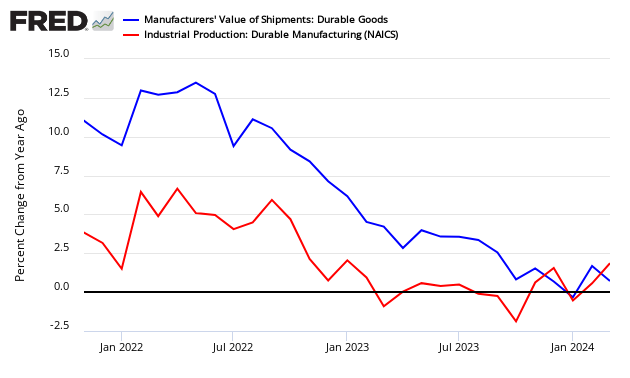
- The December Federal Reserve’s Durable Goods Industrial Production Index growth decelerated 0.7% month-over-month, up 2.8% year-over-year [note that this is a series with moderate backward revision - and it uses production as a pulse point (not new orders or shipments)] – three month trend is improving.
Comparing Seasonally Adjusted Durable Goods Shipments (blue line) to Industrial Production Durable Goods (red line)
- unadjusted backlog (unfilled orders) growth decelerated 1.6% month-over-month,.
- aircraft (civilian) were the main reason for the weakness this month (partially offset by an increase in defense capital goods) – but almost all sectors were weak.
- note this is labelled as an advance report – however, backward revisions historically are relatively slight.
- new orders down 1.0% month-over-month.
- backlog (unfilled orders) was up 0.1% month-over-month – and remains at a historical high.
- the market expected new orders at -4.8% to 2.0% month-over-month (consensus -1.6%) versus the -1.0% actual
Durable Goods sector is the portion of the economy which provides products which have a utility over long periods of time before needing repurchase – like cars, refrigerators and planes.
Econintersect concentrates on new orders as it is the entry point for future production – and somewhat intuitive economically.
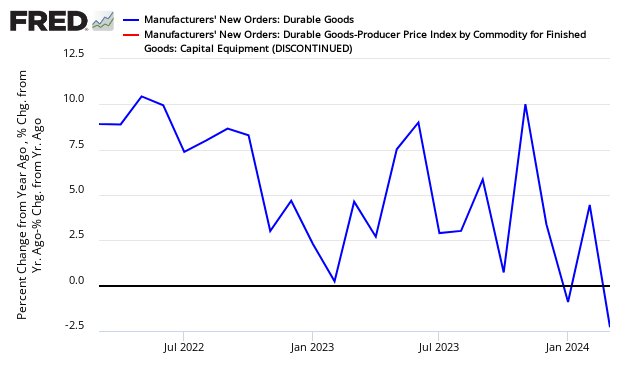
Indexed and Unadjusted Durable Goods New Orders – Orders (blue line) and Orders less Transports (red line)

The long term trend of growth for new orders continues downward since early 2012 (graph below) – but if you stand on your head, there seems to be a slight upward trend for most of 2013.
Year-over-Year Growth Durable Goods New Orders – Unadjusted (blue line) and Inflation Adjusted (red line)
The above graphic shows both the year-over-year change for unadjusted new orders and inflation adjusted new orders using the PPI for inflation adjustment.
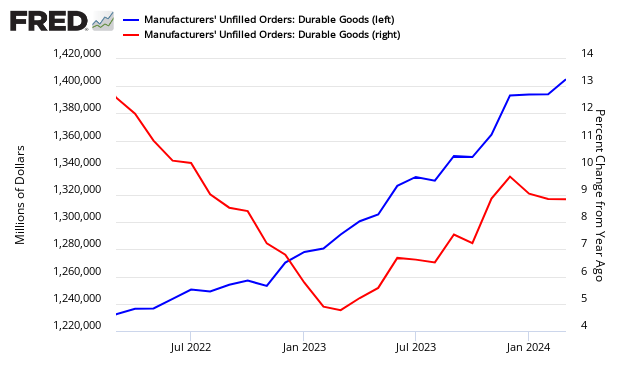
For unfilled orders (graph below), the overall trend is up.
Unadjusted Durable Goods Unfilled Orders – Current Value (blue line, left axis) and Year-over-Year Change (red line, right axis)
To visualize the drivers of durable goods – the chart below shows transport (mostly aircraft is the volatile element in durable goods.
Unadjusted Durable Goods New Orders Year-over-Year Growth – Consumer Goods less transport (blue line), All Durable Goods (green line), and Transport (red line)

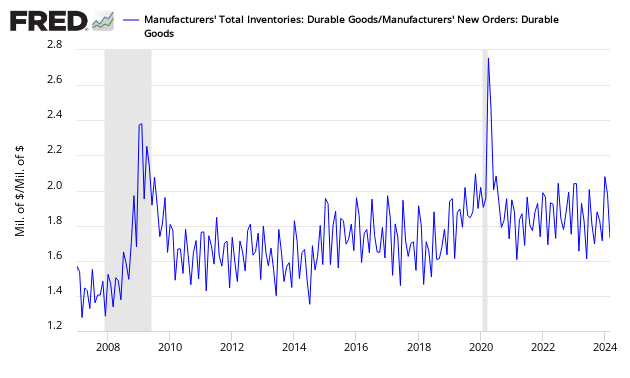
One final look at the Durable Goods data in our search for a slowing economy is for inventory buildup. Although this series is noisy, it appears inventory levels have remained relatively constant since the beginning of 2010.
Unadjusted Inventory to Sales Ratio
Caveat on the Use of Durable Goods
The data when first released is subject to several months of revision. The revisions currently have been minor – making the initial headline data reasonably accurate in real time.
The data in this series is not inflation adjusted – and Econintersect adjusts using the appropriate BLS Producer Price Index for durable goods or uses Industrial Production (IP) – durable goods sub-index which is a non-monetary index.
As in most US Census reports, Econintersect does not agree with the seasonal adjustment methodology used and provides an alternate analysis. The issue is that the exceptionally large recession and subsequent economic roller coaster has caused data distortions that become exaggerated when the seasonal adjustment methodology uses several years of data. Further, Econintersect believes there is a New Normal seasonality and using data prior to the end of the recession for seasonal analysis could provide the wrong conclusion.
Econintersect determines the month-over-month change by subtracting the current month’s year-over-year change from the previous month’s year-over-year change. This is the best of the bad options available to determine month-over-month trends – as the preferred methodology would be to use multi-year data (but the New Normal effects and the Great Recession distort historical data).
Durable goods expenditure is a major element of GDP. Therefore may pundits look for enlightenment within the durable goods data for economic direction. To illustrate how durable goods new orders and backlog fits into a recession watch, the Fred graph below (produced based on August 2011 data) shows clearly that data trends down preceding a recession. Unfortunately, there are several false indications of recessions.

More importantly, durable goods as discussed in this post is not the durable goods of the consumer – as it includes business and government consumption while excluding imports. For a better understanding of consumer demand for durable goods, the BEA’s Personal Consumption Expenditure’s Durable Goods data series should be used:
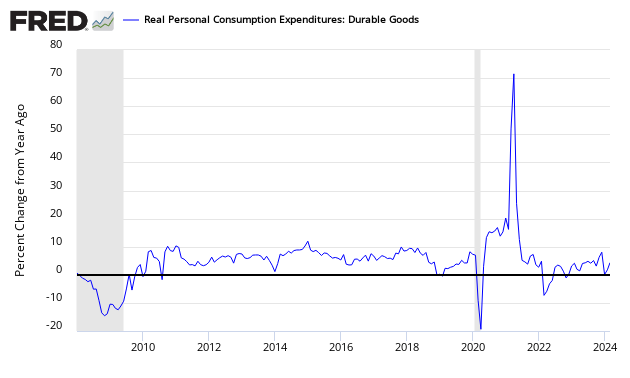
Durable goods is not a good economic forecasting tool as it contains too many false warnings of economic contraction.
None.


