Dow Jones Technical Analysis: The Index Is Falling At An Important Resistance
- The Dow Jones Industrial Average fell in its recent trading on the intraday levels, breaking a series of gains that lasted for four sessions in a row, to record losses in its last sessions by -1.14%.
- The index lost about -391.76 points, to settle at the end of trading at the level of 33,910.86 after the index rose during Trading on Friday increased by 0.33%.

What led the index downward were the earnings results of Goldman Sachs, which announced a larger-than-expected drop of 69% in profits for the fourth quarter of 2022. This happened due to heavy losses in its investment banking unit and asset management revenues, which led to a decline in its shares by nearly 7%.
Meanwhile, factory activity in New York witnessed its sharpest contraction and lowest reading since May of 2020, when the US economy was reeling from the shock of lockdowns aimed at combating the outbreak of the COVID virus.
The New York Fed's Empire State report shocked consensus by dropping to a reading of -32.9, down from an estimated reading of -11.2 for December, and more than triple the rate analysts had expected.
Market participants will get a broader view of the state of the manufacturing sector, which accounts for about 11% of the overall economy, with the Producer Price Index (PPI) and industrial production due later in the day, and the New York Fed will unveil the Philadelphia Fed figure. Thursday.
Dow Jones Technical Analysis
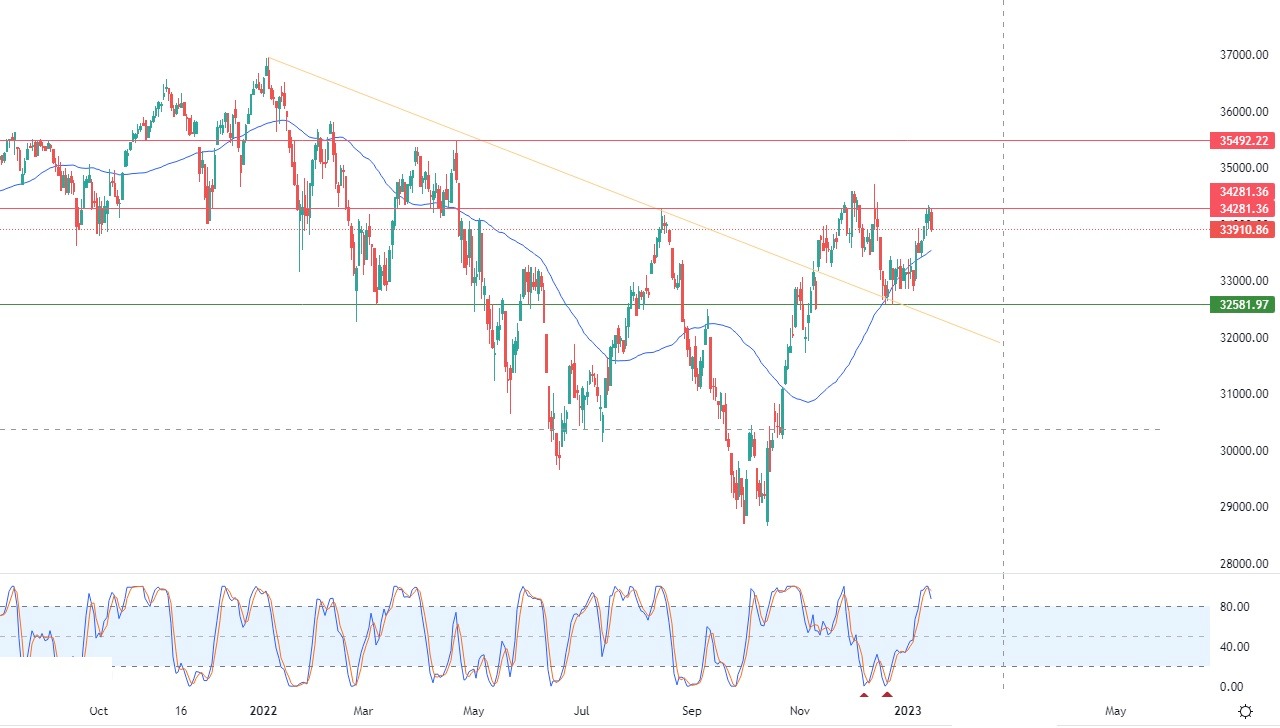
Technically, the recent decline of the index came as a result of the stability of the 34,281.36 pivotal resistance level, trying to reap the profits of its recent rises, and trying to gain positive momentum that might help it breach that resistance. At the same time, the index is trying to drain some of its clear overbought with RSI indicators, especially with Negative signals start coming from them.
This comes in light of the continued positive support for its trading above its simple moving average for the previous 50-day period. Influenced by the breach of a bearish corrective slope line earlier in the short term, as shown in the attached chart for a (daily) time.
Therefore, our expectations suggest that the index will rise again during its upcoming trading, provided that it first breaches the aforementioned 34,281.36 resistance, to then target the 35,492.00 resistance level.

More By This Author:
EUR/USD Forex Signal: Triple Top Forms Ahead Of Fed SpeakEUR/USD Forex Signal: Small Double-Top Pattern Forms
Gold Technical Analysis: Strong Overbought Levels
Disclosure: DailyForex will not be held liable for any loss or damage resulting from reliance on the information contained within this website including market news, analysis, trading signals ...
more


