Dow Jones Technical Analysis: Index Going Green
The Dow Jones Industrial Average jumped up during its recent trading at the intraday levels to achieve gains in its last sessions by 2.43%. The index added about 754.44 points and settled at the end of trading at 31,827.06, after its decline in Monday's trading by -0.69%..
US stocks posted solid gains on Tuesday as companies reported better-than-expected earnings, easing investors' fears of rising inflation likely to hurt financial results.
Home sales fell 2% to 1.559 million annually in June, compared to expectations for a smaller decline. Redbook reported that same-store retail sales in the US rose 15% year-over-year in the week ending July 16, up from 13% in the previous week.
The Fed's forecast estimate for Atlanta GDP for the second quarter was revised down to 1.6% from the 1.5% drop in the previous estimate on July 15.
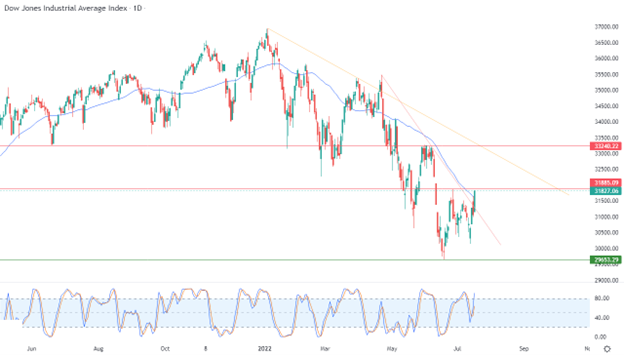
Technically, the index managed with its recent rise to breach a descending sub-trend line in the short term, as a first step to get rid of its negative pressures. This comes amid an influx of positive signals in the relative strength indicator, despite their stability in areas that are highly overbought, and the index has also crossed after gaining more positive momentum. The resistance is at the 50-day simple moving average, in preparation for attacking the important resistance level 31,885. This is the resistance that we referred to in our previous reports.
However, despite the index's recent gains, it remains under the control of a bearish corrective wave along a major slope line, as shown in the attached chart for a (daily) period.
That is why our expectations now stand on the sidelines, waiting for the index’s behavior towards the resistance level 31,885. In the event that the index manages to breach it, it will continue rising, to target immediately the resistance level 33,240. But in the event that this resistance consolidates, the index will rebound to the bottom to continue the negative expectations surrounding it.

More By This Author:
BTC/USD Forex Signal: Bullish Above $23KEUR/USD Forex Signal: Euro Continues To Grind Ahead Of ECB
Natural Gas Technical Analysis: Losing Negative Pressures
Disclosure: DailyForex will not be held liable for any loss or damage resulting from reliance on the information contained within this website including market news, analysis, trading signals ...
more


