Dow Jones Technical Analysis: Index Continues To Rise - Wednesday, Oct. 26
- The Dow Jones Industrial Average continued to rise during its recent trading at the intraday levels, achieving new gains for the third consecutive session.
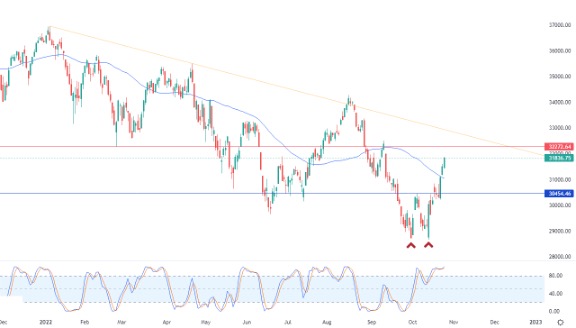
- It went up by 1.07%, rising by 337.12 new points, and settling at the end of trading at its highest level in 6 weeks at the level of 31,836.75.
- This happened after It rose 1.34% during Monday's trading.

Corporate earnings in the US continued to exceed dwindling analysts' expectations, adding positive support to stock valuations. Especially with the appearance of quarterly earnings reports for components of the index including Coca-Cola (KO), 3M (MMM) and General Electric (GE).
Meanwhile, home prices fell for the second month in a row, according to the S&P CoreLogic Case-Shiller 20 home price index for 20 cities.
The Richmond Fed's monthly manufacturing index fell to minus 10 in October from 0 in September, less than expected for a decline to minus 5. The Philadelphia Fed's monthly non-manufacturing activity fell to minus 14.9 in October. from 2.5 in the previous month.
The Conference Board's index of consumer confidence fell to 102.5 in October from a reading of 107.8 in September, below the 105.3 expected.
Following this weak data, risk appetite rebounded among investors, as expectations increased that the Federal Reserve would reverse its hawkish policy in raising interest rates. The US Central Bank is now expected to raise interest rates by an additional 75 basis points when it meets next week, but it may indicate that he is likely to reduce increases in subsequent meetings, including the 50 basis points expected in December.
Dow Jones Technical Analysis
Technically, the index’s rise comes after it succeeded in the previous trading in getting rid of the negative pressure of the simple moving average for the previous 50 days. In light of its being affected by a positive technical structure that formed earlier in the short term, which is the double bottom pattern, as shown in the attached chart for a (daily) period.
But in front of that, the index remains moving along a corrective bearish slope line in the short term.
Therefore, our expectations indicate more cautious ascent for the index during its upcoming trading, to target the important and close 32,272.64 resistance level.

More By This Author:
GBP/USD Forex Signal: Pound Sterling Faces One Key HurdleBTC/USD Forex Signal: Still Rangebound As It Diverges From Stocks
XAU/USD Technical Analysis: Rebounding As The Dollar's Gains Stop
Disclosure: DailyForex will not be held liable for any loss or damage resulting from reliance on the information contained within this website including market news, analysis, trading signals ...
more


