
Dow Jones And Crude Oil Reaching The End Of The Line
All I have seen throughout the day was one article after the next speculating on what Yellen may have meant when she said. Well whatever it is that she said, I do not care what Janet Yellen said or what she thinks is going to happen in the future.
Tell me the last time a central bank actually got it right? As far as I can see,
There is only one single thing that the Fed has ever been good at doing and that is doing the WRONG THING at the wrong time, pretty much all of the time.
Now is no different ten Years pumping the financial system full of cheap credit.
Maintaining a dying banking system on life support, propping up and ever increasing the size of government. And of course inflating the greatest financial bubble of all history.
What a record! And people still want to hear what this woman has to say? Get real people!
This financial bubble is on its last legs, and will collapse with an horrendous force. The economic damage will be severe, And the central bank will have no small part to play in this coming tragedy. Who knows, With a bit of luck she will be the last central bank chair. God knows, we could do without all the speculating on the meaning of her platitudes!
Enough ranting!
USDJPY
30 min
(Click on image to enlarge)

4 Hours
(Click on image to enlarge)

Daily
(Click on image to enlarge)
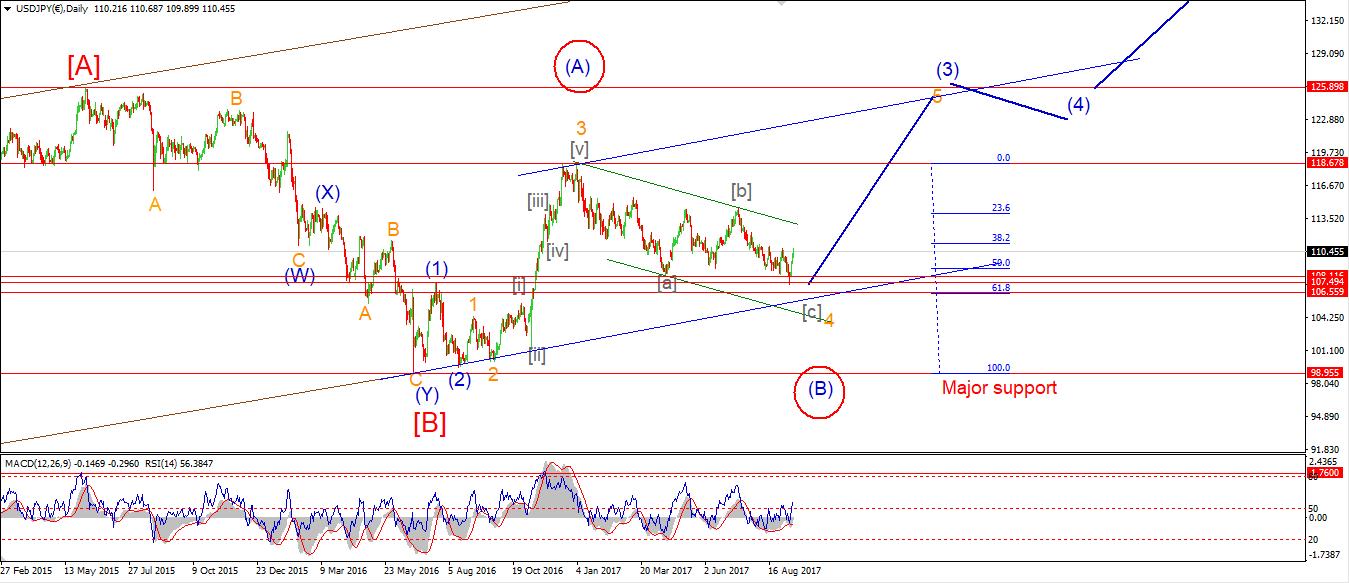
My Bias: LONG
Wave Structure: rally in wave [C]
Long term wave count: wave [C] is underway, upside to above 136.00
Important risk events: JPY: N/A. USD: Core Durable Goods Orders m/m, Pending Home Sales m/m, Crude Oil Inventories.
USDJPY turned up again off the low labelled wave '2' pink. So far the price has stopped short of 112.71, the recent high at wave '1' pink.
Wave '3' up will be confirmed by a break higher than 112.71, initial support and the short term invalidation line lies at 111.04.
For tomorrow: watch for a break above 112.71, and the beginning of wave '3' of 'iii'.
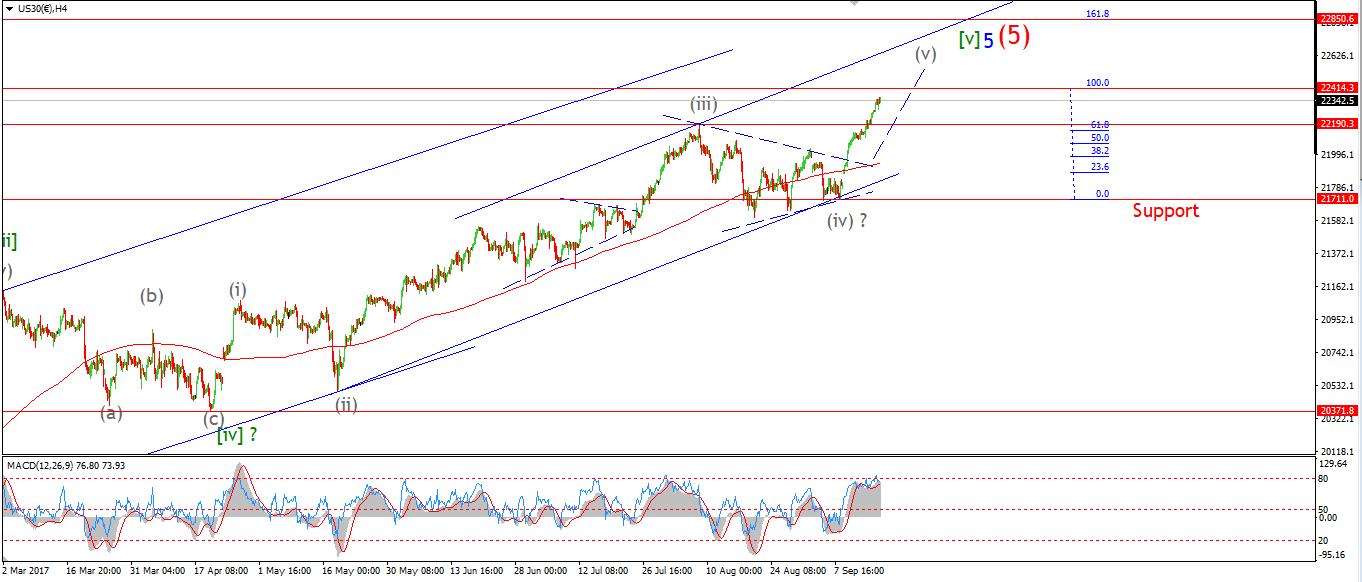
Dow Jones Industrial
30 min
(Click on image to enlarge)

4 Hours
(Click on image to enlarge)
Daily
(Click on image to enlarge)

My Bias: market topping process ongoing
Wave Structure: Impulsive 5 wave structure, possibly topping in an all time high.
Long term wave count: Possibly topping in wave (5)
Important risk events: USD: Core Durable Goods Orders m/m, Pending Home Sales m/m, Crude Oil Inventories.
The DOW lurched higher today and then gave up the gains again. There is a possibility that wave '2' blue is an expanded flat which is drawing to a close as I write. The rising trendline seems to be offering support to the price at the moment.
22225 remains key support for the short term count. The prospect of one more high in wave 'v' seems all the more likely now As recent declines have all the hallmarks of a correction so far.
For tomorrow: watch for the next leg up in wave '3' blue to begin. This should take the price above the all time high again.
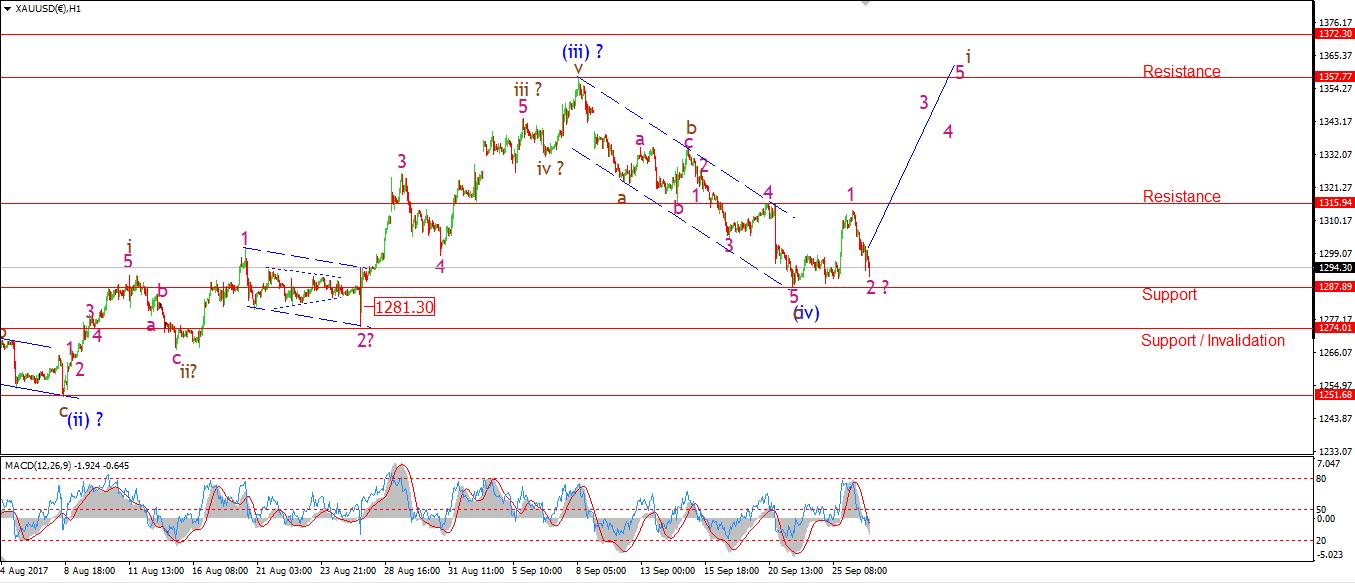
Gold
30 min
(Click on image to enlarge)
4 Hours
(Click on image to enlarge)

Daily
(Click on image to enlarge)

My Bias: Long towards 1550
Wave Structure: ZigZag correction to the upside.
Long term wave count: Topping in wave (B) at 1550
Important risk events: USD: Core Durable Goods Orders m/m, Pending Home Sales m/m, Crude Oil Inventories.
On the 4hr chart I can see that momentum has now turned fully bullish again. This may take another few days to assert itself in the price but another rally phase is building. We can be sure of that.
The 200MA has acted as a resistance today, a break above that line again will be another bullish signal. So far, the 1274 high of wave (i) blue has remained untouched, this is in line with the current wave count. But as I mentioned before, if that level breaks,I will switch to the alternate wave count on the daily chart which is even more bullish in the long run!
For now I remain on the look out for signs that wave (v) blue has begun.
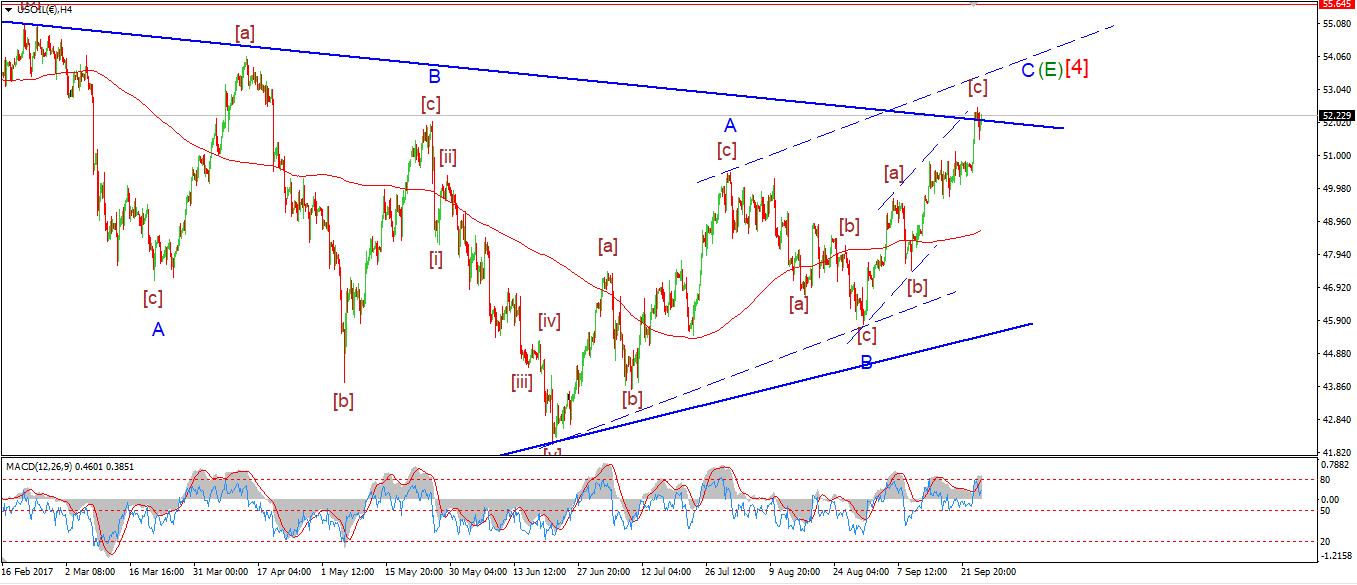
U.S Crude Oil
30 min
(Click on image to enlarge)

4 Hours
Daily
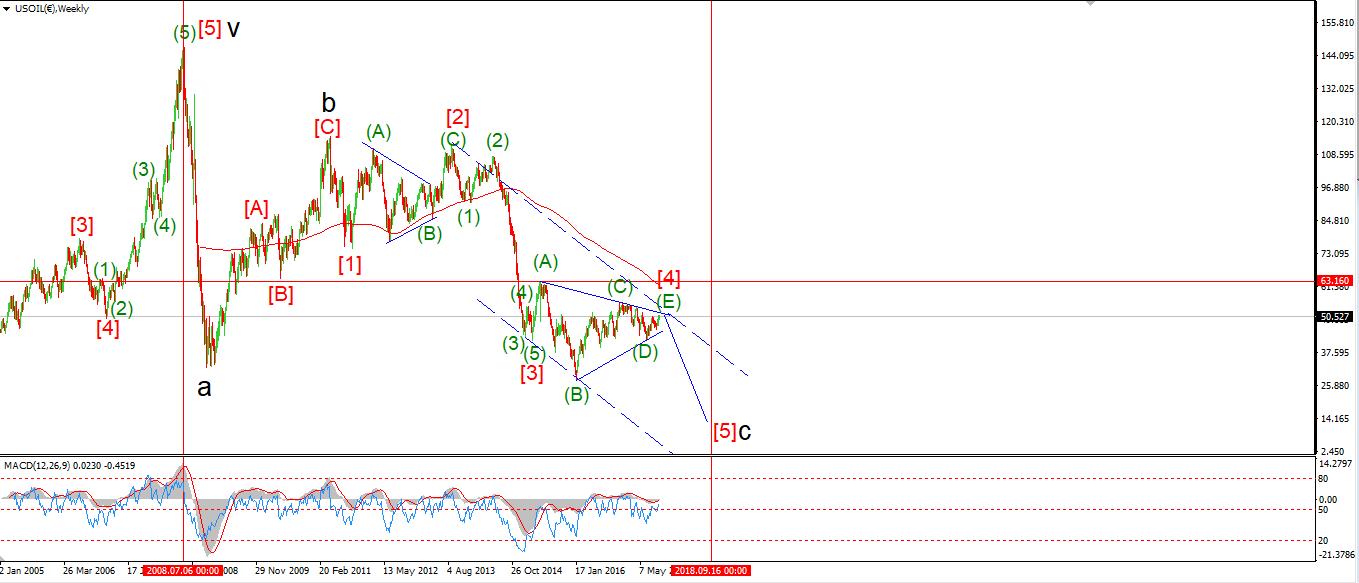
My Bias: topping in a large correction fourth wave.
Wave Structure: ZigZag correction to the downside.
Long term wave count: Declining in wave 'c' target, below $20
Important risk events: USD: Core Durable Goods Orders m/m, Pending Home Sales m/m, Crude Oil Inventories.
Crude oil came off the boil today's as expected by the wave count. The decline looks to be in a three wave form in a possible wave 'iv' pink.
Today's low came in at 51.43, and the price has bounced since then. This level now forms support for wave 'v' pink as it gets underway. Wave 'v' will likely top out in the region of 53.00,
This is where the price will meet the first trend channel resistance.
On the 4hr chart, you will notice a triple top in MACD and RSI. This fact, along with a completing wave count and trend channel resistance, Should serve to turn the price down soon.
For tomorrow: watch for a break above the wave 'iii' high and a rally into the trend channel to complete wave 'v'.
Want to know the next big move in the Dollar, GOLD and the DOW?
Check out our membership plan over at ...
more

