
The Extended Disorder Family (or Cluster):
(i) uncertainty, (ii) variability, (iii) imperfect, incomplete knowledge, (iv) chance, (v) chaos, (vi) volatility, (vii) disorder, (viii) entropy, (ix) time, (x) the unknown, (xi) randomness, (xii) turmoil, (xiii) stressor, (xiv) error, (xv) dispersion of outcomes, (xvi) unknowledge.
Nassim Taleb, “Anti-Fragile”

In this week’s Dirty Dozen [CHART PACK], we cover a SPX that’s set to consolidate/retrace, bonds breaking down, presidential cycle stats, HF positioning, China’s mutant economy, bullish sugar, bearish silver, and more…
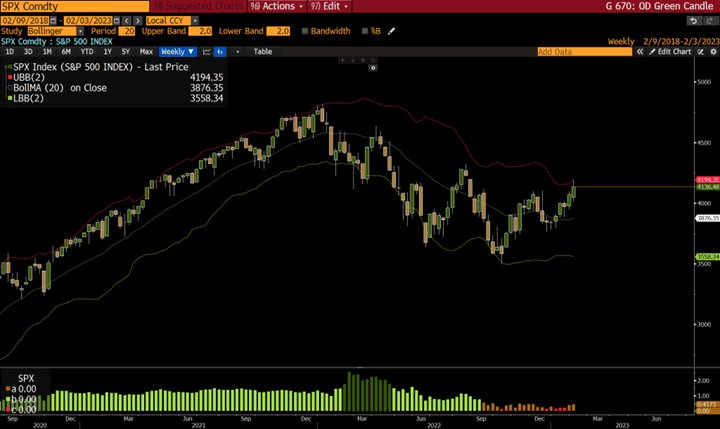
- SPX is short-term overextended and at resistance (it’s upper weekly Bollinger Band + a significant monthly level that has rejected price since last Spring). We have conviction that it will punch through this time, but we’ll likely see a small pullback or consolidation first, so expect some chop and vol this week.
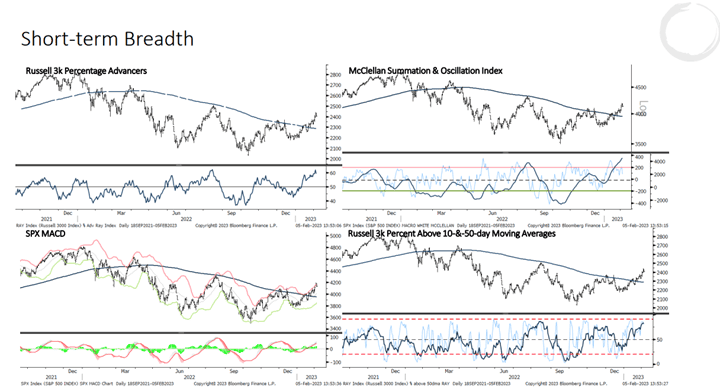
- Key to watch: Momentum and short-term breadth indicators such as those below. These collectively signaled failed bullish breakouts on each of the last market advances over the past year. They are strong for now, but we’ll have to see how they hold up in the week ahead.
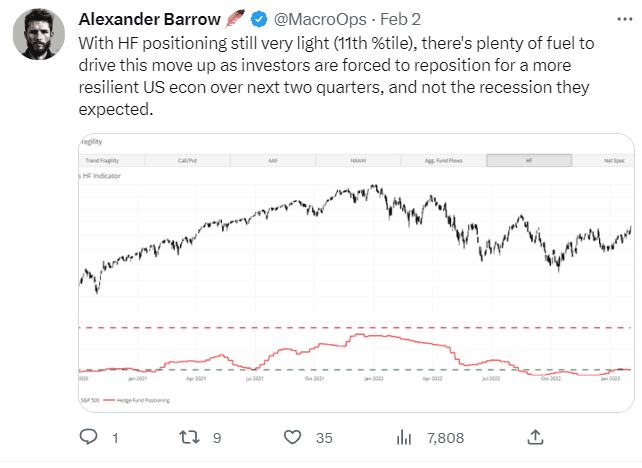
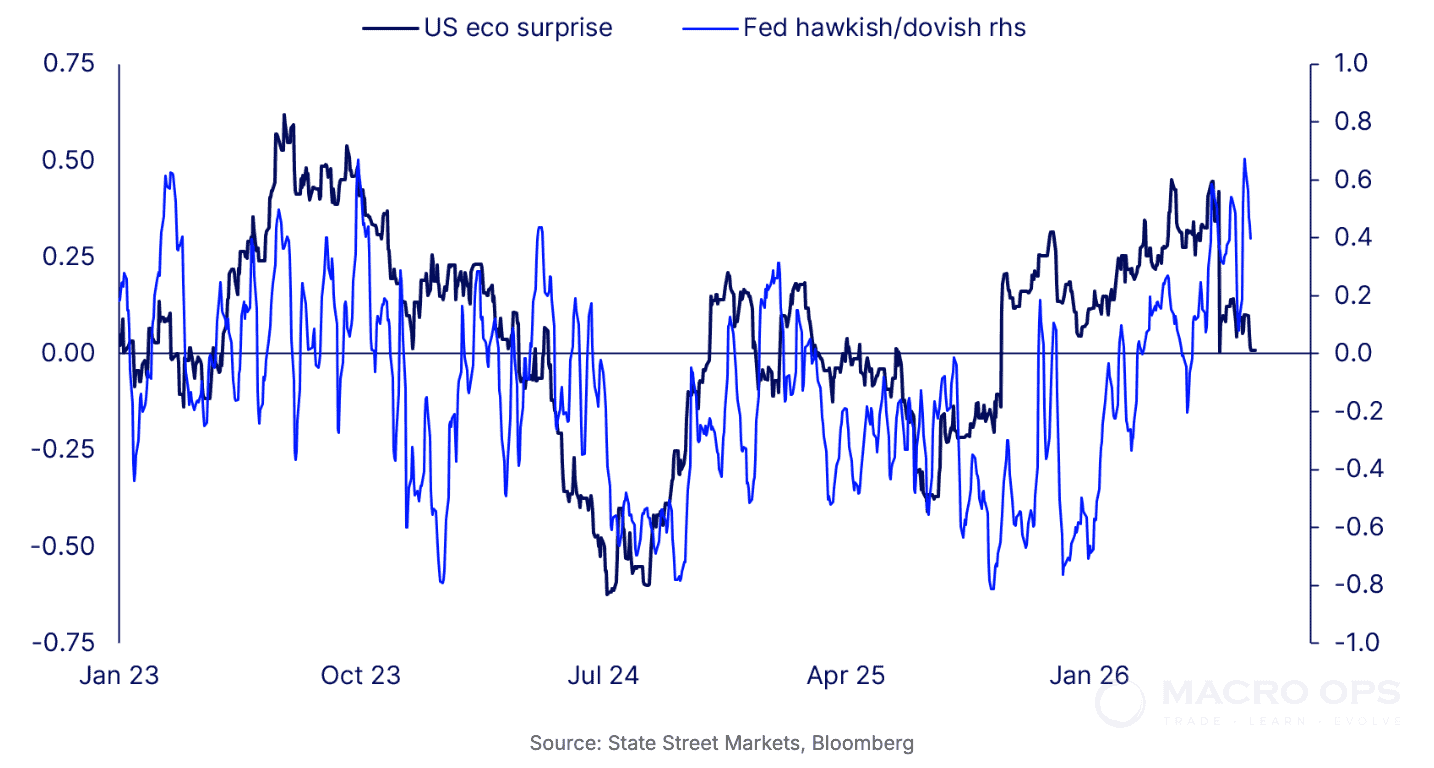
- Reminder: Hedge fund positioning remains very light. As the US economy continues to surprise to the upside over the next few months, we’ll see this chart trend up as they chase prices higher = bull fuel.
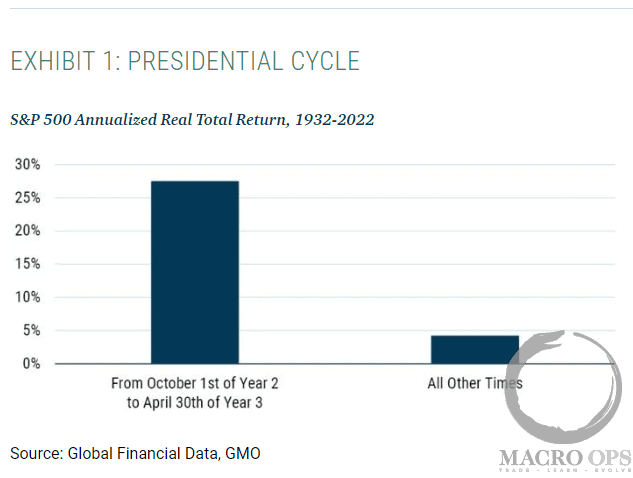
- Jeremy Grantham of GMO fame commenting on the Presidential Cycle via this report (emphasis by me):
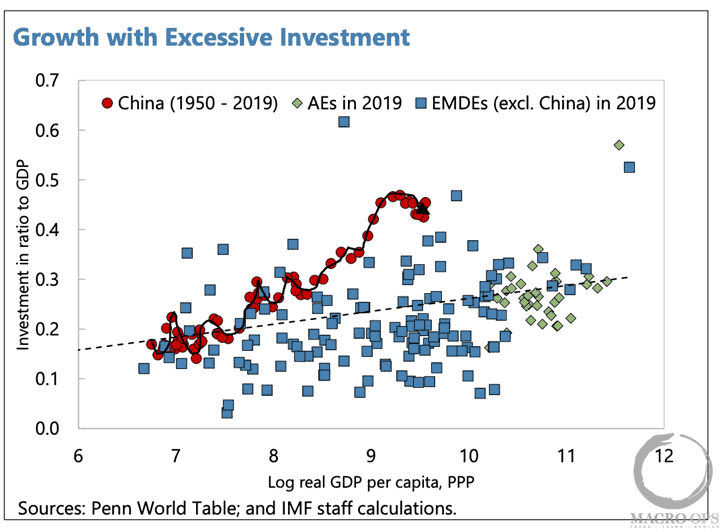
- Adam Tooze’s substack is one of my favorite regular chart-heavy reads. I highly recommend signing up. His latest (link here) focuses on China’s real estate and investment heavy economy, a topic we’ve covered extensively over the years.
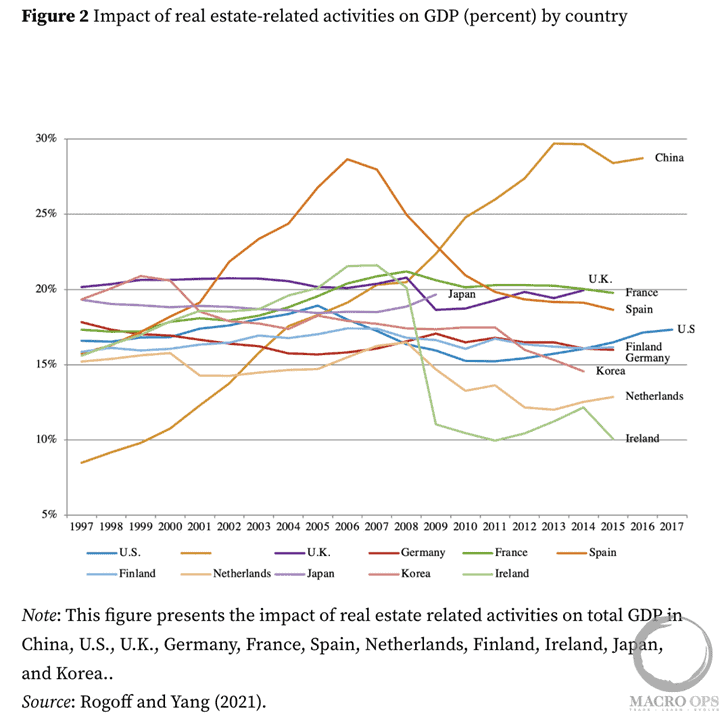
Here’s the impact of real estate on GDP by country.
- Here’s a few things that stood out to me from his piece:
According to the IMF “China’s residential housing sales averaged 1.5-1.6 billion square meters per year from 2018-2021, about 30-50 percent higher than estimated annual demand for the next few years based on demographic and housing stock factors.”
“The latest estimates by Rogoff and Yang 2022 suggest that real estate development, directly and indirectly, has driven 25 percent of total economic activity in China.”
“On the basis of census data, Rogoff and Yang estimate that 43 percent of all homes in China had been built since 2010, 68 percent since 2000 and 88 percent since 1990. If you put this in relation to total population it implies that in a single generation, China has built enough homes to house a billion people.”
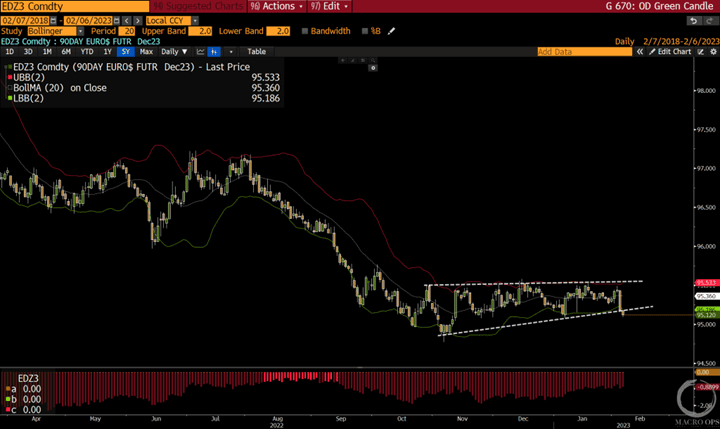
- Dec 23’ Eurodollars are breaking down from a 5-month compression zone. Compression zones lead to expansionary regimes (trends). We believe this trend is down (yields up).
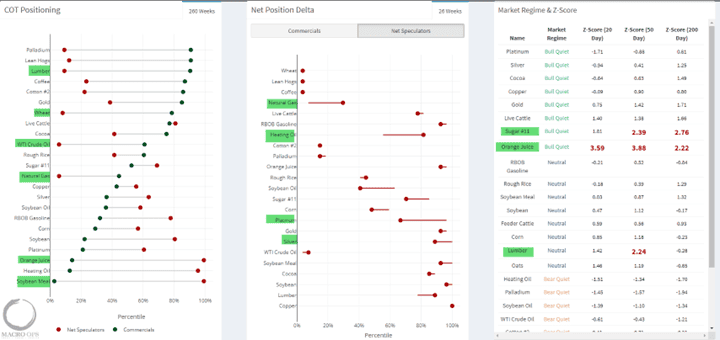
- Our Commodities dashboard gives us a quick look at notable extremes in positioning, changes in that positioning, price moves, as well as market SQN regime. Some standouts: Specs very short lumber, wheat, crude oil, natural gas. And they’re very long Soybean Meal and Orange Juice. Interestingly, Net Specs have started dramatically cutting their short positioning in natty over the past two weeks, which is typically what leads to a bottom.
Lastly, sugar is very overbought across multiple timeframes, as is orange juice.
- I pitched the bull setup in sugar (ETF alternative: CANE) in these pages back at the start of Dec (link here). Following an initial fakeout, it has since broken out to new highs. It’s trading in a Bull Quiet regime, and it just completed a strong bullish thrust. The weekly and monthly charts look even better.
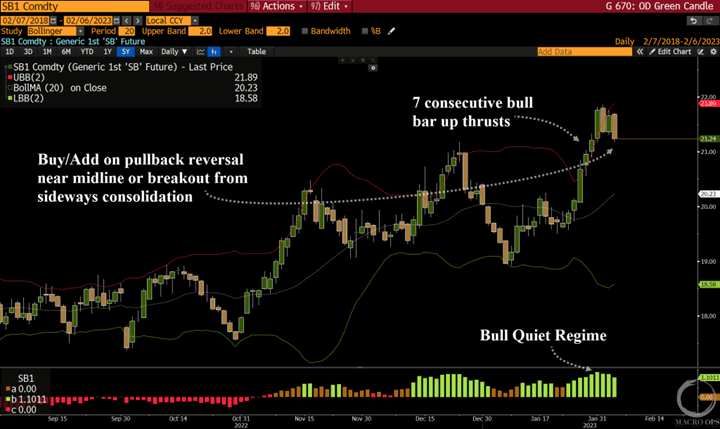
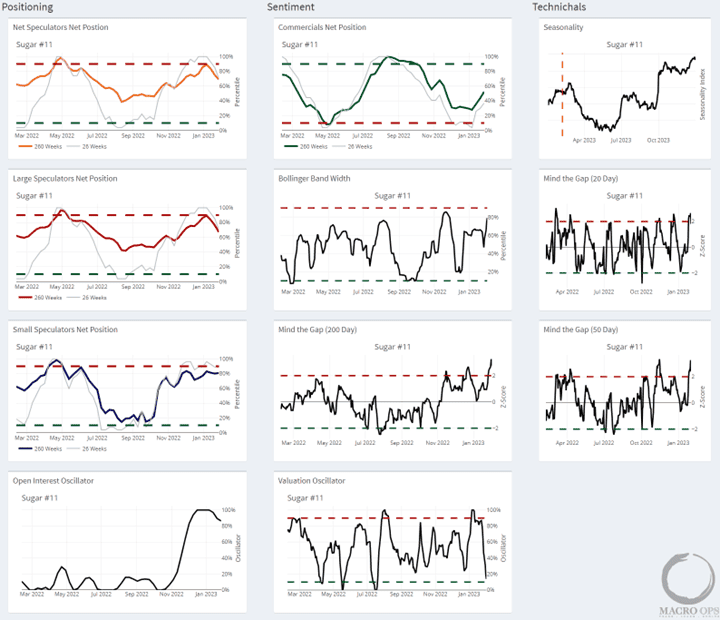
- However, the short-term picture suggests that a period of consolidation or retracement is likely.
Net specs are paring back their longs from historically extended levels. Price is 1.9, 2.4, and 2.8 standard deviations above its 20, 50, and 200-day moving averages respectively. Our Open Interest Oscillator is coming off the 100th %tile, indicating a lot of attention on that market. Plus, seasonality is about to become a headwind.
We’ll use a healthy retrace/consolidation to get long.
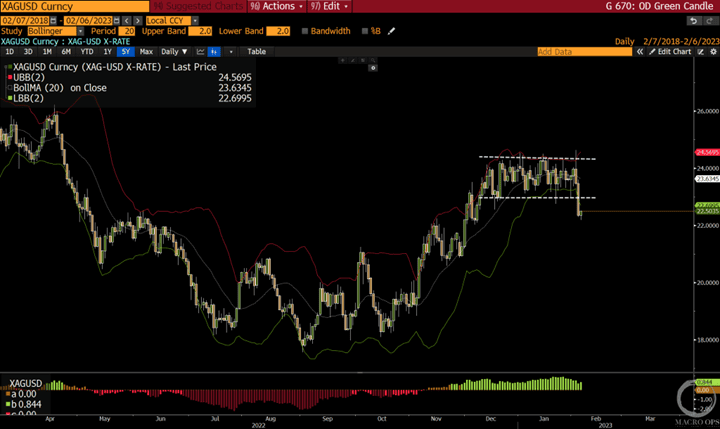
- Over the last two weeks, I’ve written about a probable short-term top forming in precious metals. We got confirmation of that on Friday.
We remain bullish PMs over the next 1-3 years, but a retrace here would be healthy. It’ll be important to see how the tapes hold up.
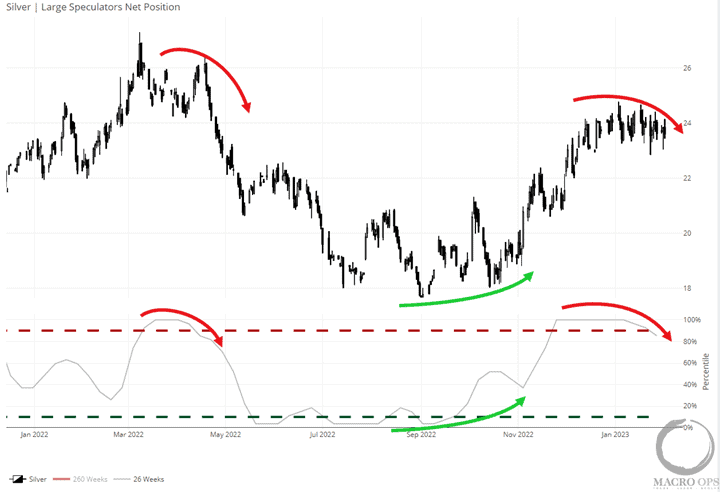
- There are a few ways to view CoT data (1) absolute numbers (2) on a long-term OI-adjusted basis to look at positioning extremes, and (3) short-term oscillators to track changes in positioning.
Here’s an example of why it pays to look at the delta of short-term positioning. This chart shows large net speculator positioning on an oscillator basis over a 6-month timeframe.
When it rolls over from high readings, it’s saying that bullish positioning is becoming less so, and vice versa for low readings. These positioning changes often lead (and create) the tops and bottoms. We can see that large specs are cutting their long positioning in silver.
More By This Author:
If You’re Not A Little Long, You’re Wrong… [Dirty Dozen]
Yields Are Headed Higher For Longer… [Dirty Dozen]
Double-Barrelled Buy Signal

Comments
Log in or sign up to join the conversation.