
Does Growth Slowing Suddenly Matter?

One of my favorite sayings on Wall Street is, "Things don't matter until they do. But then they matter a lot."
For example, the dueling issues of #GrowthSlowing and the flattening yield curve have been with us for quite some time now. In fact, we've known that global growth has been slowing for more than a year. We've known that the torrid pace of growth in the U.S. economy and corporate earnings would have to slow for almost as long. And we've been watching the yield on the U.S. 10-year fall steadily for the last 6 months.
Yet on Thursday, March 21, 2019, the stock market appeared to make a meaningful break above an important resistance zone as the S&P 500 and Nasdaq both stepped lively to their highest respective closes since last October. To the bulls, this meant that investors were ignoring the current data (you know, the growth slowing stuff) and focusing on better days ahead.
After all, the Fed has reversed course and is now on hold, and the trade deal - the deal that the bulls hope will spark a resurgence in global economic activity - is expected to get done. All good, right?
Lest we forget, the stock market is a discounting mechanism of future activity. So, the bullish premise actually made some sense.
But then it happened. The yield curve (as defined by the spread between the yield on the U.S. 3-Month T-Bill and the 10-Year Treasury Bond) inverted. Meaning that the yield of the longer-dated bonds fell below that of short-term T-Bills.
Yep, that's right; what is known as the nearly infallible predictor of U.S. recessions flashed a sell signal on Friday. And apparently the algos knew what to do with that.
Suddenly, the concept of #GrowthSlowing mattered. No one had given it a thought the day before. But now that the predictor of the last seven recessions here in the good 'ol USofA had flipped from green to red, this was suddenly a problem.
As in a drop of -2% kind of a problem.
The impetus for the rather sudden concern about the yield curve was the nasty manufacturing data out of Germany and the Eurozone. In short, Germany's PMI, as calculated by IHS Markit, fell to the lowest level since 2012 and the New Orders component hit it's lowest reading since, wait for it... 2008. Ouch.
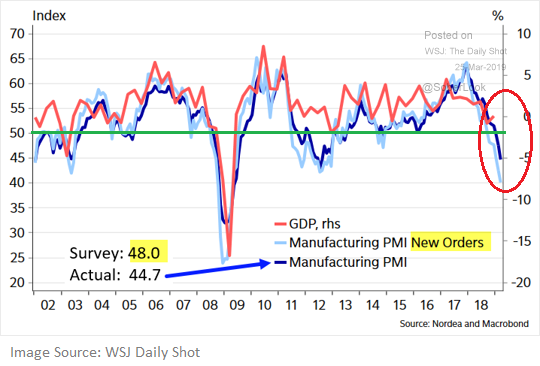
This report was accompanied by the fact that Germany's official GDP for Q4 came in at 0.0% and the PMI for the Euro area was the weakest since 2013. Now couple this not-so-hot news with some recent weak data in the U.S., the yield curve inverting, and word that the Mueller Report would be delivered imminently and well, things started to unravel pretty quickly Friday.
So, Is It Time To Worry?
Another WallStreet-ism that might be applicable here is, "one day does not a trend make."
In this case, it is important to recognize that the yield curve inverting for a single day isn't "the" signal that a recession is about to happen. Especially in the era of high-speed trading (across all markets, around the globe) where things can - and often do - turn on a dime.
No, the point is that the yield curve will need to stay inverted for some time before we should view this as a harbinger of bad things to come.
The chart below makes this point clear. On a monthly basis, the yield curve has inverted before the last three recessions. But it also important to note that the yield curve has inverted at least eight times since 1965. And yes, six times recessions did follow. But the key here is that the indicator isn't perfect. Nor has it even flashed a signal yet (although we are just a week away from the latest update).
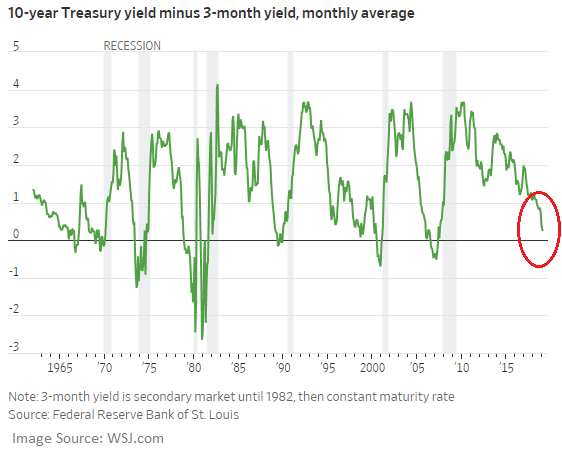
In addition, those seeing the glass as at least half-full can argue that there is generally a pretty decent lag between the time when the yield curve inverts and when a recession begins. As such, there is still time for good things to happen.
You know, like a tremendous trade deal. Or lower rates to encourage home buying and capex. Or action by the central bankers of the world. Or for the data to improve.
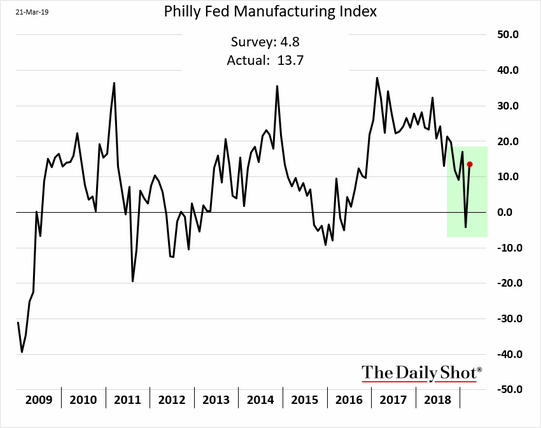
On that note, don't look now bear fans, but last week's Philly Fed report actually rebounded nicely in March.
In addition, the recent report from the Conference Board's Leading Economic Indicators came in above expectations. As did the latest data on Existing Home Sales.
Speaking of the data - particularly the U.S. data, that is - let's also keep in mind that the long government shutdown likely impacted the efficiency/accuracy of some of the numbers. So, there's that.
To be sure, the trend of a lot of economic data has not been going in the right direction. As such, it will be important to keep an extra close eye on the data in the coming months. Because in short, if the trend can turn - or at least flatten out - then the risk of recession in the U.S. declines.
The Key Point
My key point on this fine Monday morning is that from a macro point of view, nothing changed on Friday. There was no new information provided. I.E. Everybody knows that growth has been slowing.
The question we should be asking is if the slowdown is going to get worse. Remember, the U.S. economy is driven by the consumer. And the bottom line is consumers like to spend money. Unless, of course, there is a crisis that puts their jobs or the economy at risk. Then they tend to stop on a dime and wait to see if everything will be okay. But then it's back to the malls and to all those shopping sites.
So, will the inverted yield curve become reason enough for traders to move to a risk-off mode for a while? Sure, that could certainly happen. The big boys and girls on Wall Street do love a good bout of volatility to spruce up their trading returns.
But for most of this year, investors - you know, the folks with an investing time frame beyond lunch - have been looking at the bright side. And unless something bad actually happens, I would expect to see this continue. Once the dust settles, of course.
Weekly Market Model Review
Now let's turn to the weekly review of my favorite indicators and market models...
The State of the Big-Picture Market Models
I like to start each week with a review of the state of my favorite big-picture market models, which are designed to help me determine which team is in control of the primary trend.
View My Favorite Market Models Online
The Bottom Line:
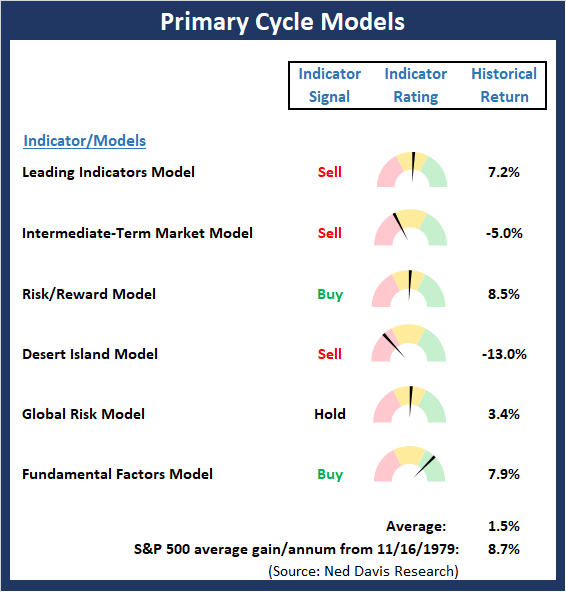
- There were no changes to the "Primary Cycle" board this week. The bottom line is the board continues to suggest that this is not a low risk, pedal-to-the-metal environment and that some caution remains warranted.
This week's mean percentage score of my 6 favorite models slipped to 47% from 50% last week (Prior readings: 47.9%, 45.4%, 40.3%) while the median held steady at 50.0% from 50% last week (Prior readings: 50%, 46.3%, 42.5%).
The State of the Trend
Once I've reviewed the big picture, I then turn to the "state of the trend." These indicators are designed to give us a feel for the overall health of the current short- and intermediate-term trend models.
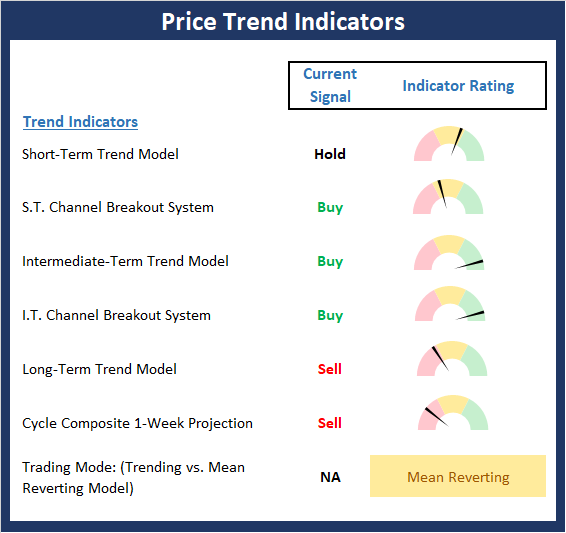
View Trend Indicator Board Online
The Bottom Line:
- Until Friday of last week, the trend was clear. Thursday's action appeared to confirm that a breakout had occurred and that a new leg higher was about to begin. However, Friday's reaction to the yield curve inverting and late news that the Mueller Report would be released caused the sell algos to kick into high gear. The selling erased the bull's work for the week and puts the status of the near-term trend in question. The good news is the longer-term trend indicators remain in good shape.
The State of Internal Momentum
Next up are the momentum indicators, which are designed to tell us whether there is any "oomph" behind the current trend.
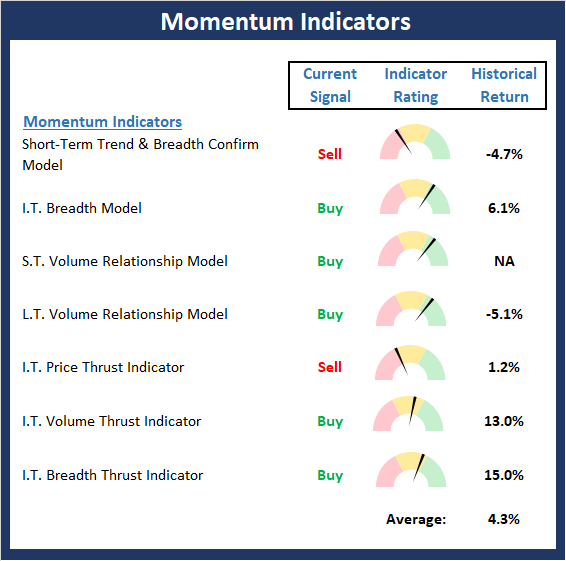
View Momentum Indicator Board Online
The Bottom Line:
- The Momentum board suggests that the internals have slipped a bit over the last few weeks. However, I will again state that due to the strong momentum seen during the initial phase of the rally, this board tells us a buy-the-dip environment remains present.
The State of the "Trade"
We also focus each week on the "early warning" board, which is designed to indicate when traders might start to "go the other way" -- for a trade.
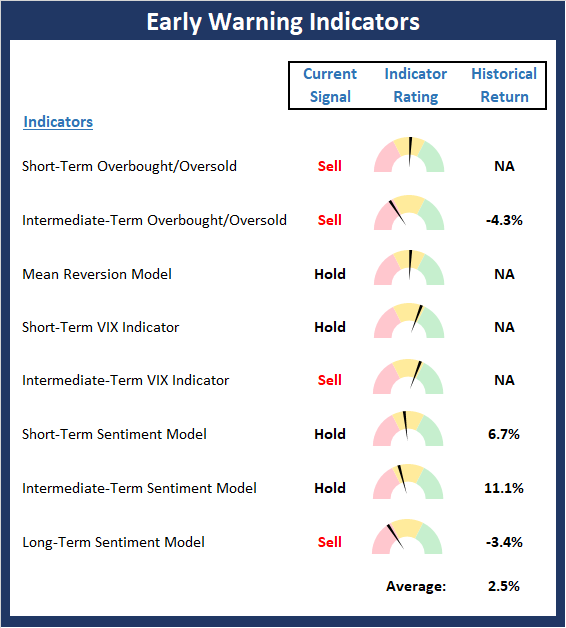
View Early Warning Indicator Board Online
The Bottom Line:
- The Early Warning board continues to wave a yellow flag but at this stage, doesn't really give either team an edge.
The State of the Macro Picture
Now let's move on to the market's fundamental factors - the indicators designed to tell us the state of the big-picture market drivers including monetary conditions, the economy, inflation, and valuations.
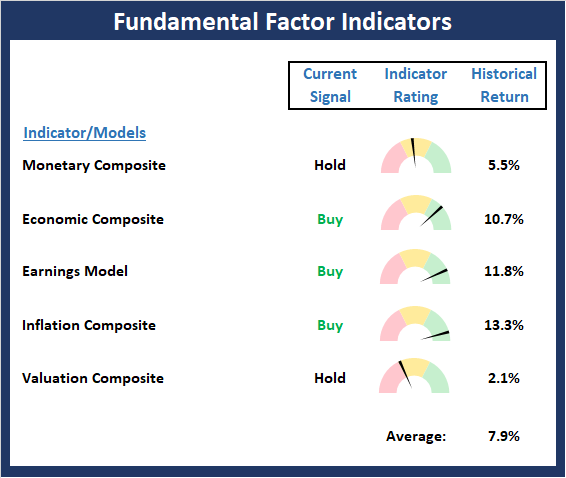
View Fundamental Indicator Board Online
The Bottom Line:
- There are no real changes to be found on the Fundamentals board. In short, the board suggests the backdrop remains constructive and for now at least, the bulls have possession.
Disclosure: At the time of publication, Mr. Moenning held long positions in the following securities mentioned: none - Note that positions may change at any time.
The opinions and forecasts ...
more

