Does Everyone Know Their ABC's? If Not Take A Look At The S&P 500 Here
Recently I got into a talk about the basics of Elliott Wave Theory. Without rehashing a lot of the basic theory again, remember its all about 5's and 3's. Just remember that part and it'll keep you centered for the purposes of this conversation.
As stated in the last report.
In bull markets its all about 5 waves up in a major degree when all said and done.
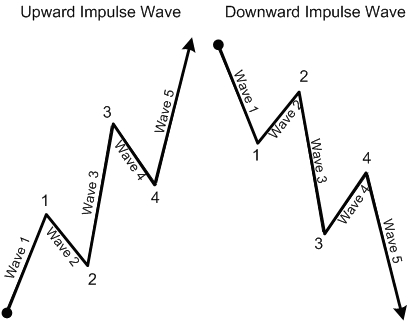
Upon completion of a whole big picture 5 waves up the same 5 waves up big picture wave count reverses itself to 5 waves down which are commonly referred to as bear markets. Does everyone remember this diagram ?

This is what the whole sequence looks like upon completion.
Its no secret our current bull market cycle is getting long in the tooth here by historical standards compared to other of the past. This one is going on 8 years now!
I bring this up because there is going to come a time where our markets go into a bear market as we all know.
There will be stocks that take major headers to the downside.
Think I'm kidding? Just take a look at the chart below because it is an excellent example of the whole sequence from start to finish played out in a real stock vs a diagram of the sequences.

How bout it!
$100 per share all the way back down to a full blown retest of its whole run to the $15 per share zone! How'd you like to be short during that ride! See what those who have learned how to sell short have to look forward to?
What's really crazy is YELP's drop wasn't even during a classic macro bear market cycle either. One would also be wise to take note of the following :
This is a great example of what a high flying momentum market leading stocks looks like when they top!
Ok, now lets get back to what this report is all about and that is a pattern that MAY be building here big picture. Take a look at the current SPX chart.

Now lets go back to our diagram of what 5 waves up looks like

NOTE: See Waves 2 and 4? They are corrective waves in up trending markets and issues. Typically corrective waves are comprised of ABC pullbacks to prior support lines, a particular moving average or even a key Fibonacci retracement zone. We've seen it time and time again folks.
Now lets take a look at a current chart of the SPX and apply what the diagrams above just walked us thru and what MAY be currently occurring assuming we are actually following the script.

Notice Waves 2 and 4? Each are ABC pullbacks.
See that Yellow box? Now IF this is the current script we are following then as you can see we MAY actually be in the final 5th wave up here. So that said lets zoom in on the 5th wave.

Now lets zoom in on everything in yellow above and apply it to the current SPX chart.

So there you have it. Here we are being very close to elections with a market that THUS far refuses to budge to the downside to any great degree. However as you can see we have a red A and B showing with a C yet to show up. The questions are, will we? And if so to what degree of depth and for how long will it last. The answer is I have no clue nor does anyone else, all we know is that per everything we've just went thru above it sure is following the wave 4 script potentiality.
At this point overall its just something to be aware of. IF we do break to the upside for a final run per the Elliott Wave Theory diagrams laid out then its the 5th wave higher of the big 5th wave to end the whole bull cycle.In other words the final hurrah. Whether it truly comes to fruition is another story, I nor anyone else on the planet knows this. All I'm doing is laying out a script that the market seems to be following.
Disclosure: None.


thanks for sharing