
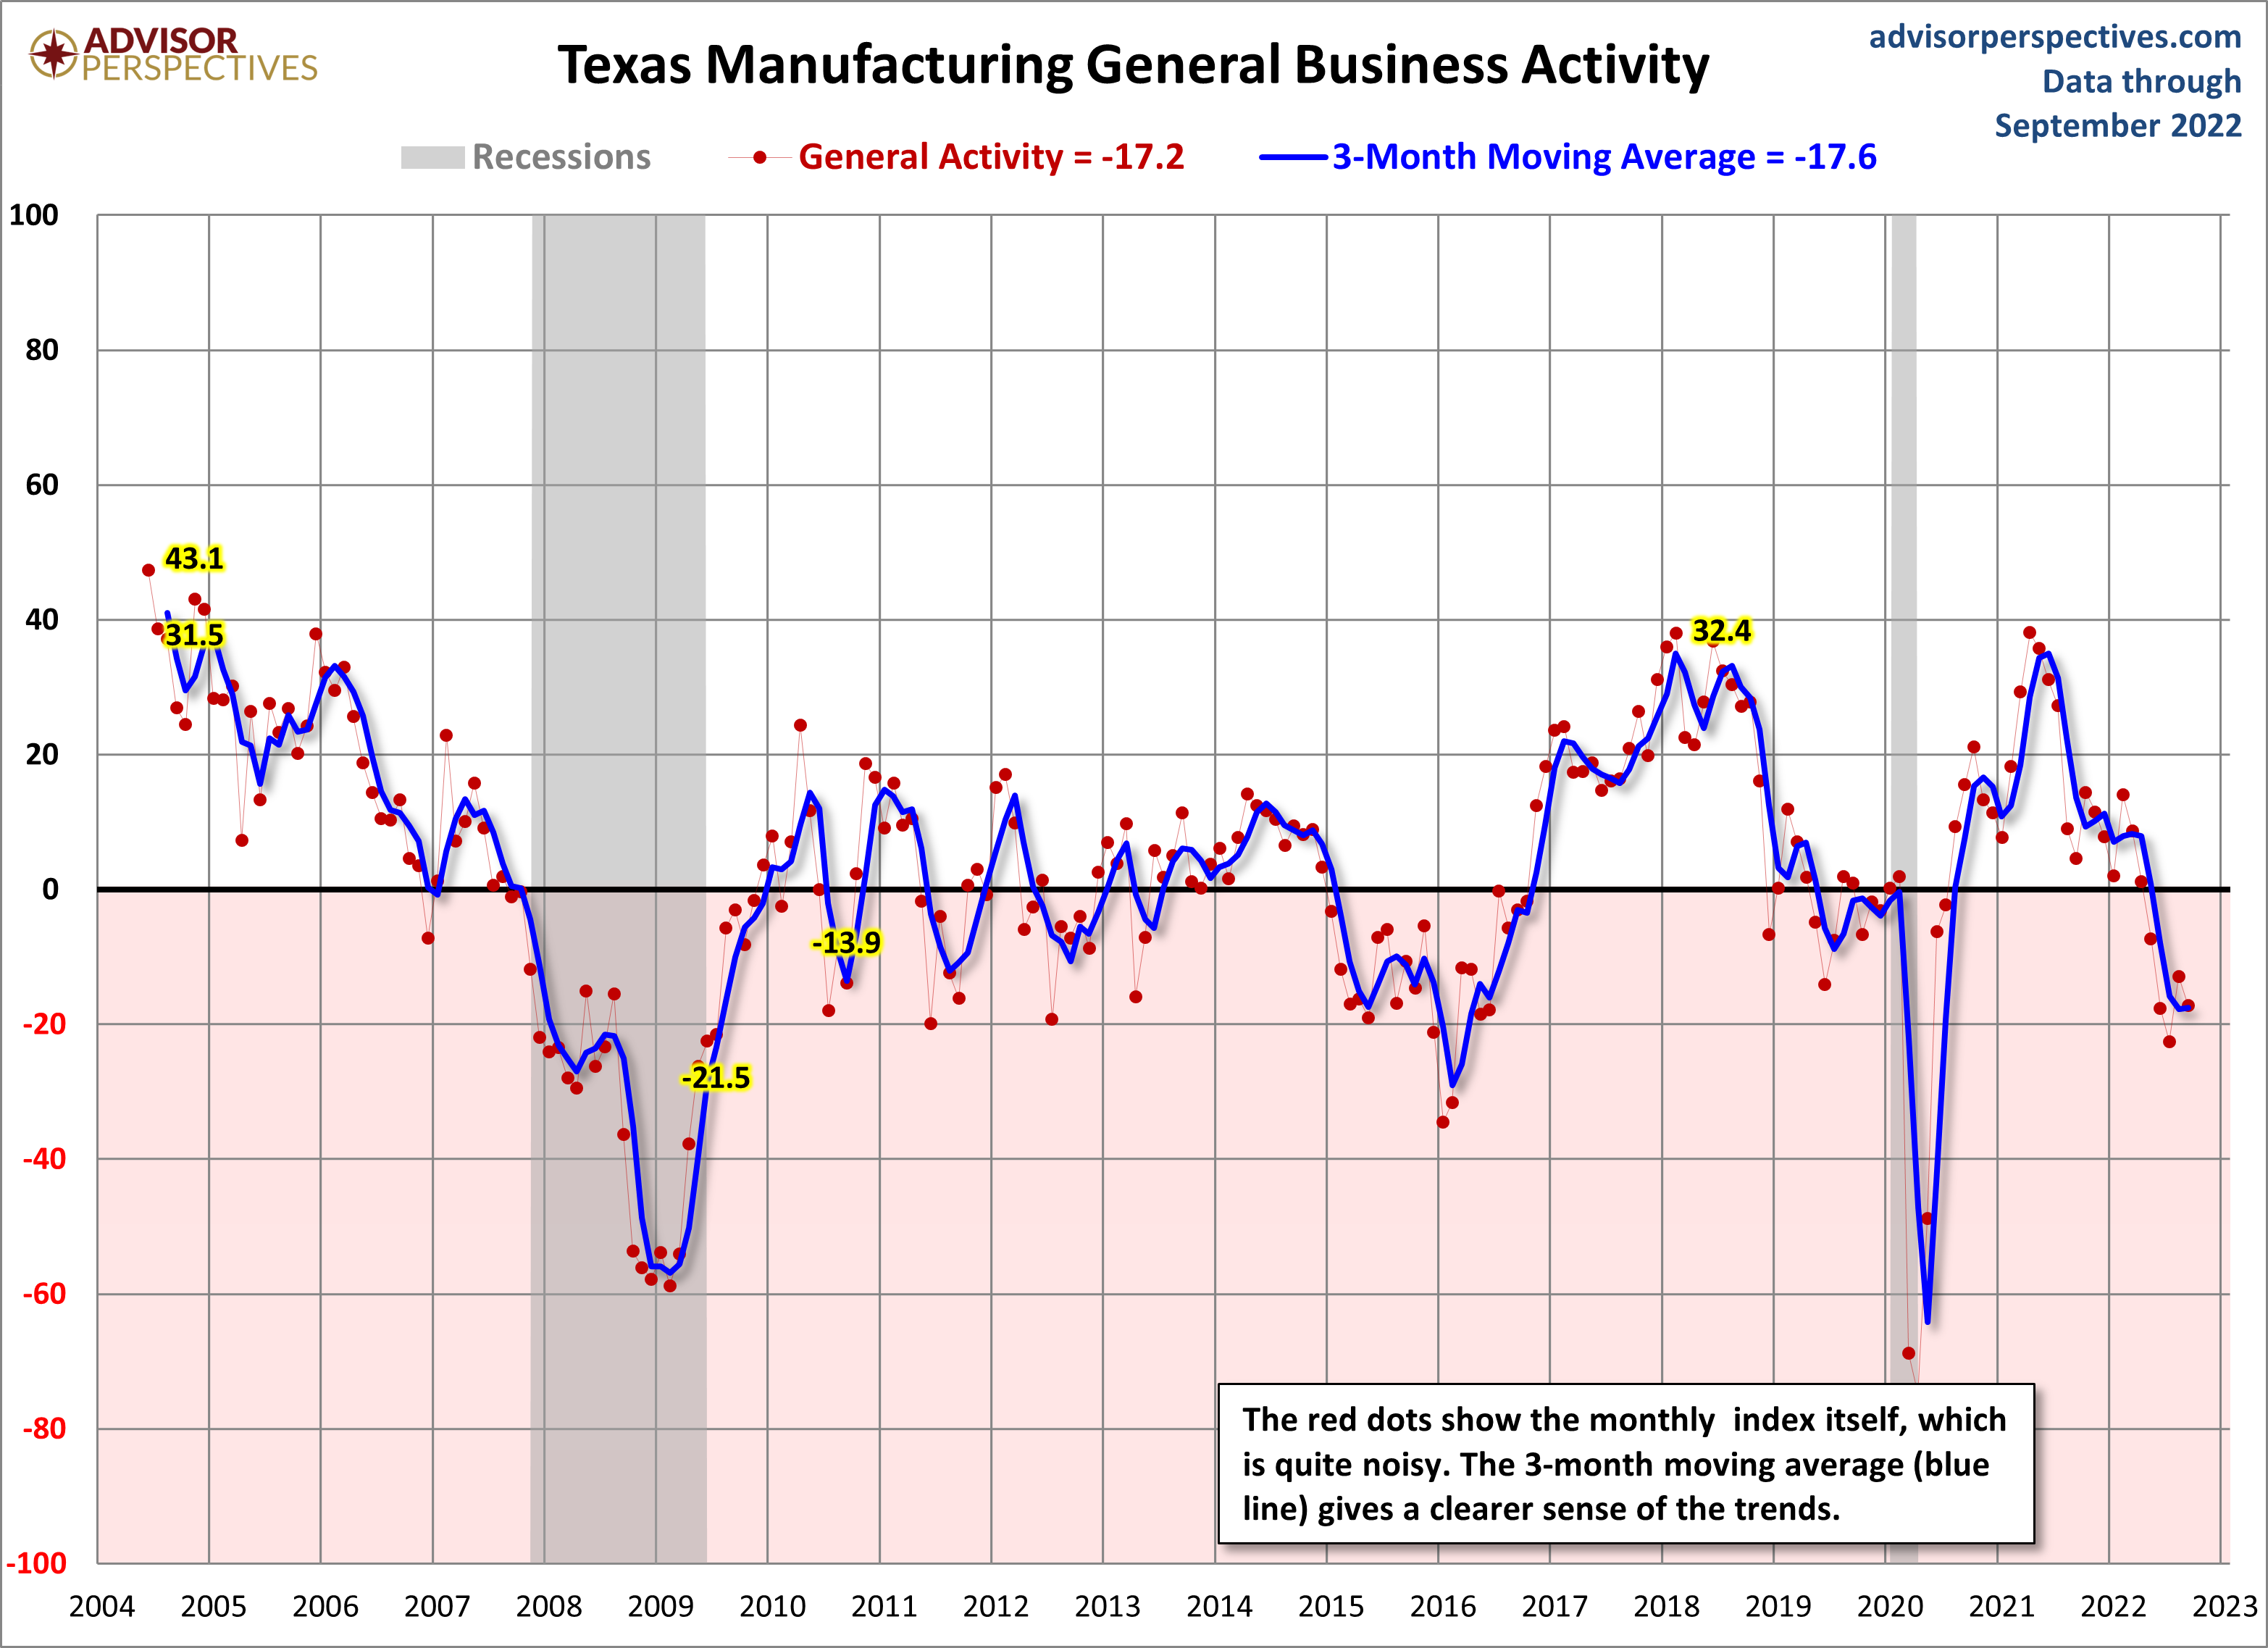
The Dallas Fed released its Texas Manufacturing Outlook Survey (TMOS) for September. The latest general business activity index came in at -17.2, down 4.3 from last month. All figures are seasonally adjusted.
Here is an excerpt from the latest report:
Growth in Texas factory activity picked up in September, according to business executives responding to the Texas Manufacturing Outlook Survey. The production index, a key measure of state manufacturing conditions, rose eight points to 9.3, a reading suggestive of stronger output growth.
Perceptions of broader business conditions continued to worsen in September. The general business activity index pushed further negative, from -12.9 to -17.2. The company outlook index moved down three points to -10.7. The outlook uncertainty index remained elevated and inched up to 27.2.
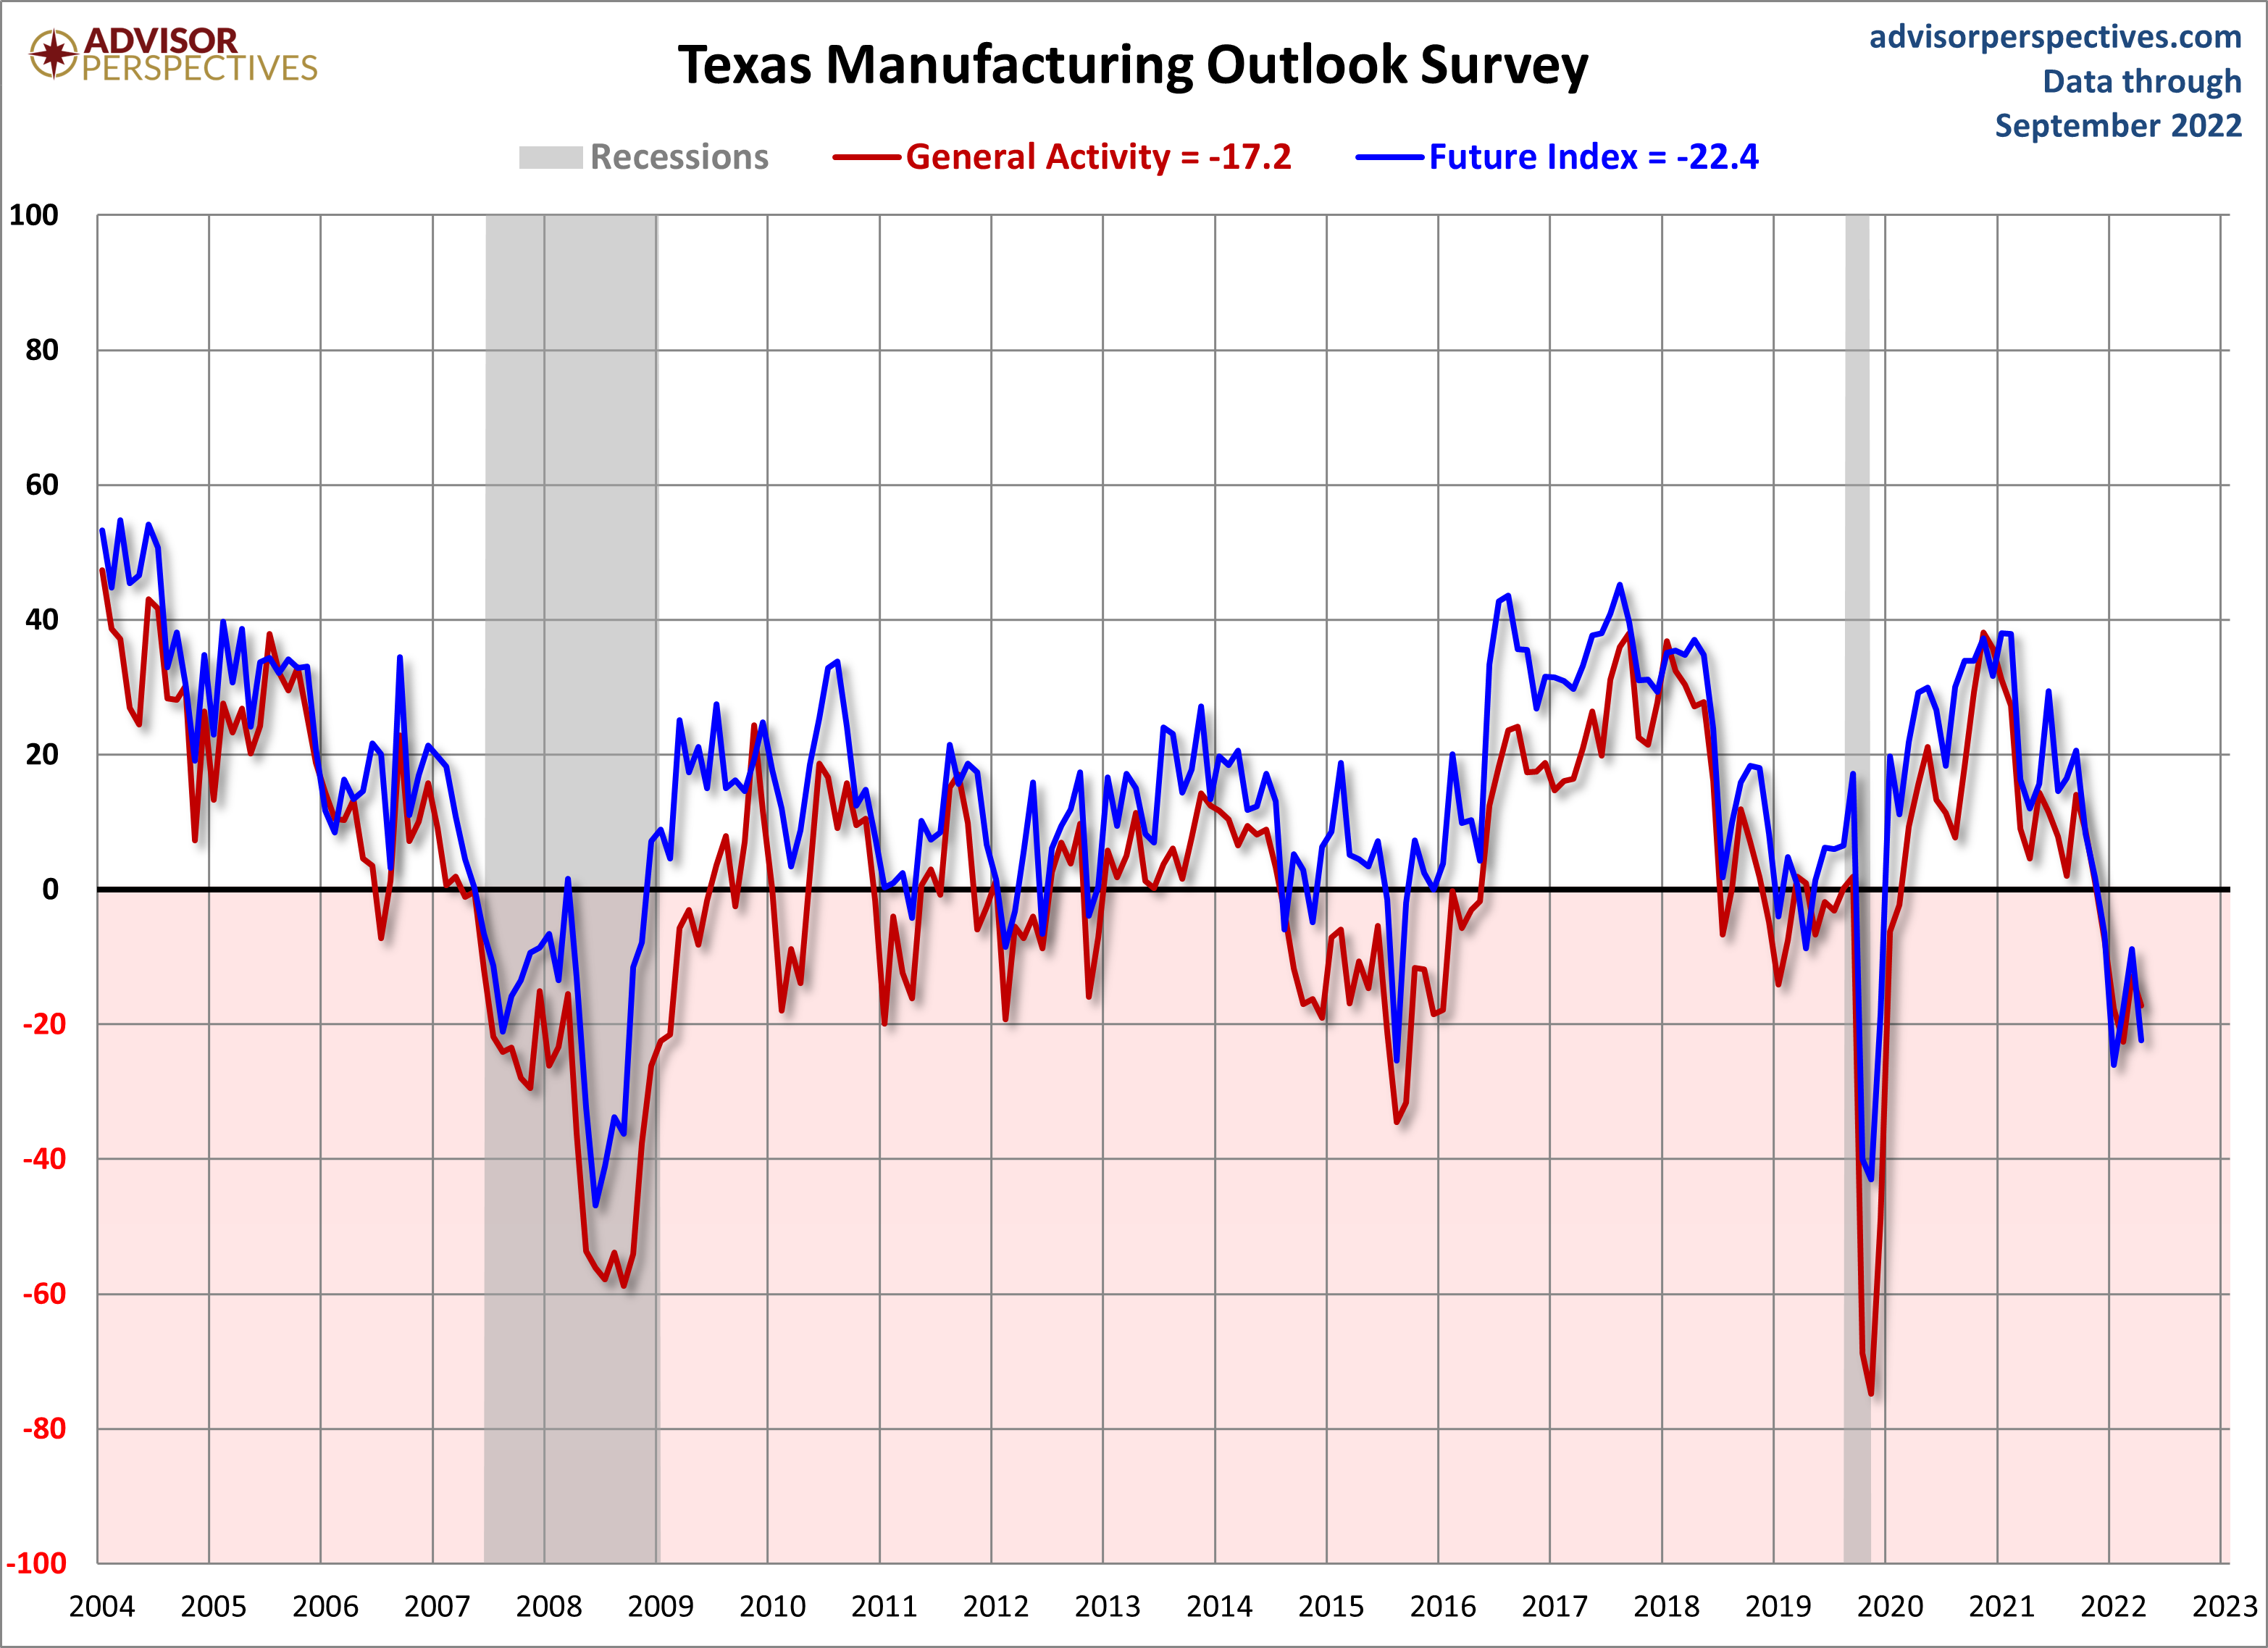
Expectations regarding future manufacturing activity were mixed in September. While the future production index pushed further into positive territory at 28.3, the future general business activity index remained negative and dropped 14 points to -22.4. Other measures of future manufacturing activity, like new orders and employment, pushed further positive in September.
Monthly data for this indicator only dates back to 2004, so it is difficult to see the full potential of this indicator without several business cycles of data. Nevertheless, it is an interesting and important regional manufacturing indicator. The Dallas Fed on the TMOS importance:
Texas is important to the nation’s manufacturing output. The state produced $159 billion in manufactured goods in 2008, roughly 9.5 percent of the country’s manufacturing output. Texas ranks second behind California in factory production and first as an exporter of manufactured goods.
Texas turns out a large share of the country’s production of petroleum and coal products, reflecting the significance of the region’s refining industry. Texas also produces over 10 percent of the nation’s computer and electronics products and nonmetallic mineral products, such as brick, glass and cement.
Here is a snapshot of the complete TMOS.
(Click on image to enlarge)
The next chart is an overlay of the General Business Activity Index and the Future Outlook Index — the outlook six months ahead.
(Click on image to enlarge)
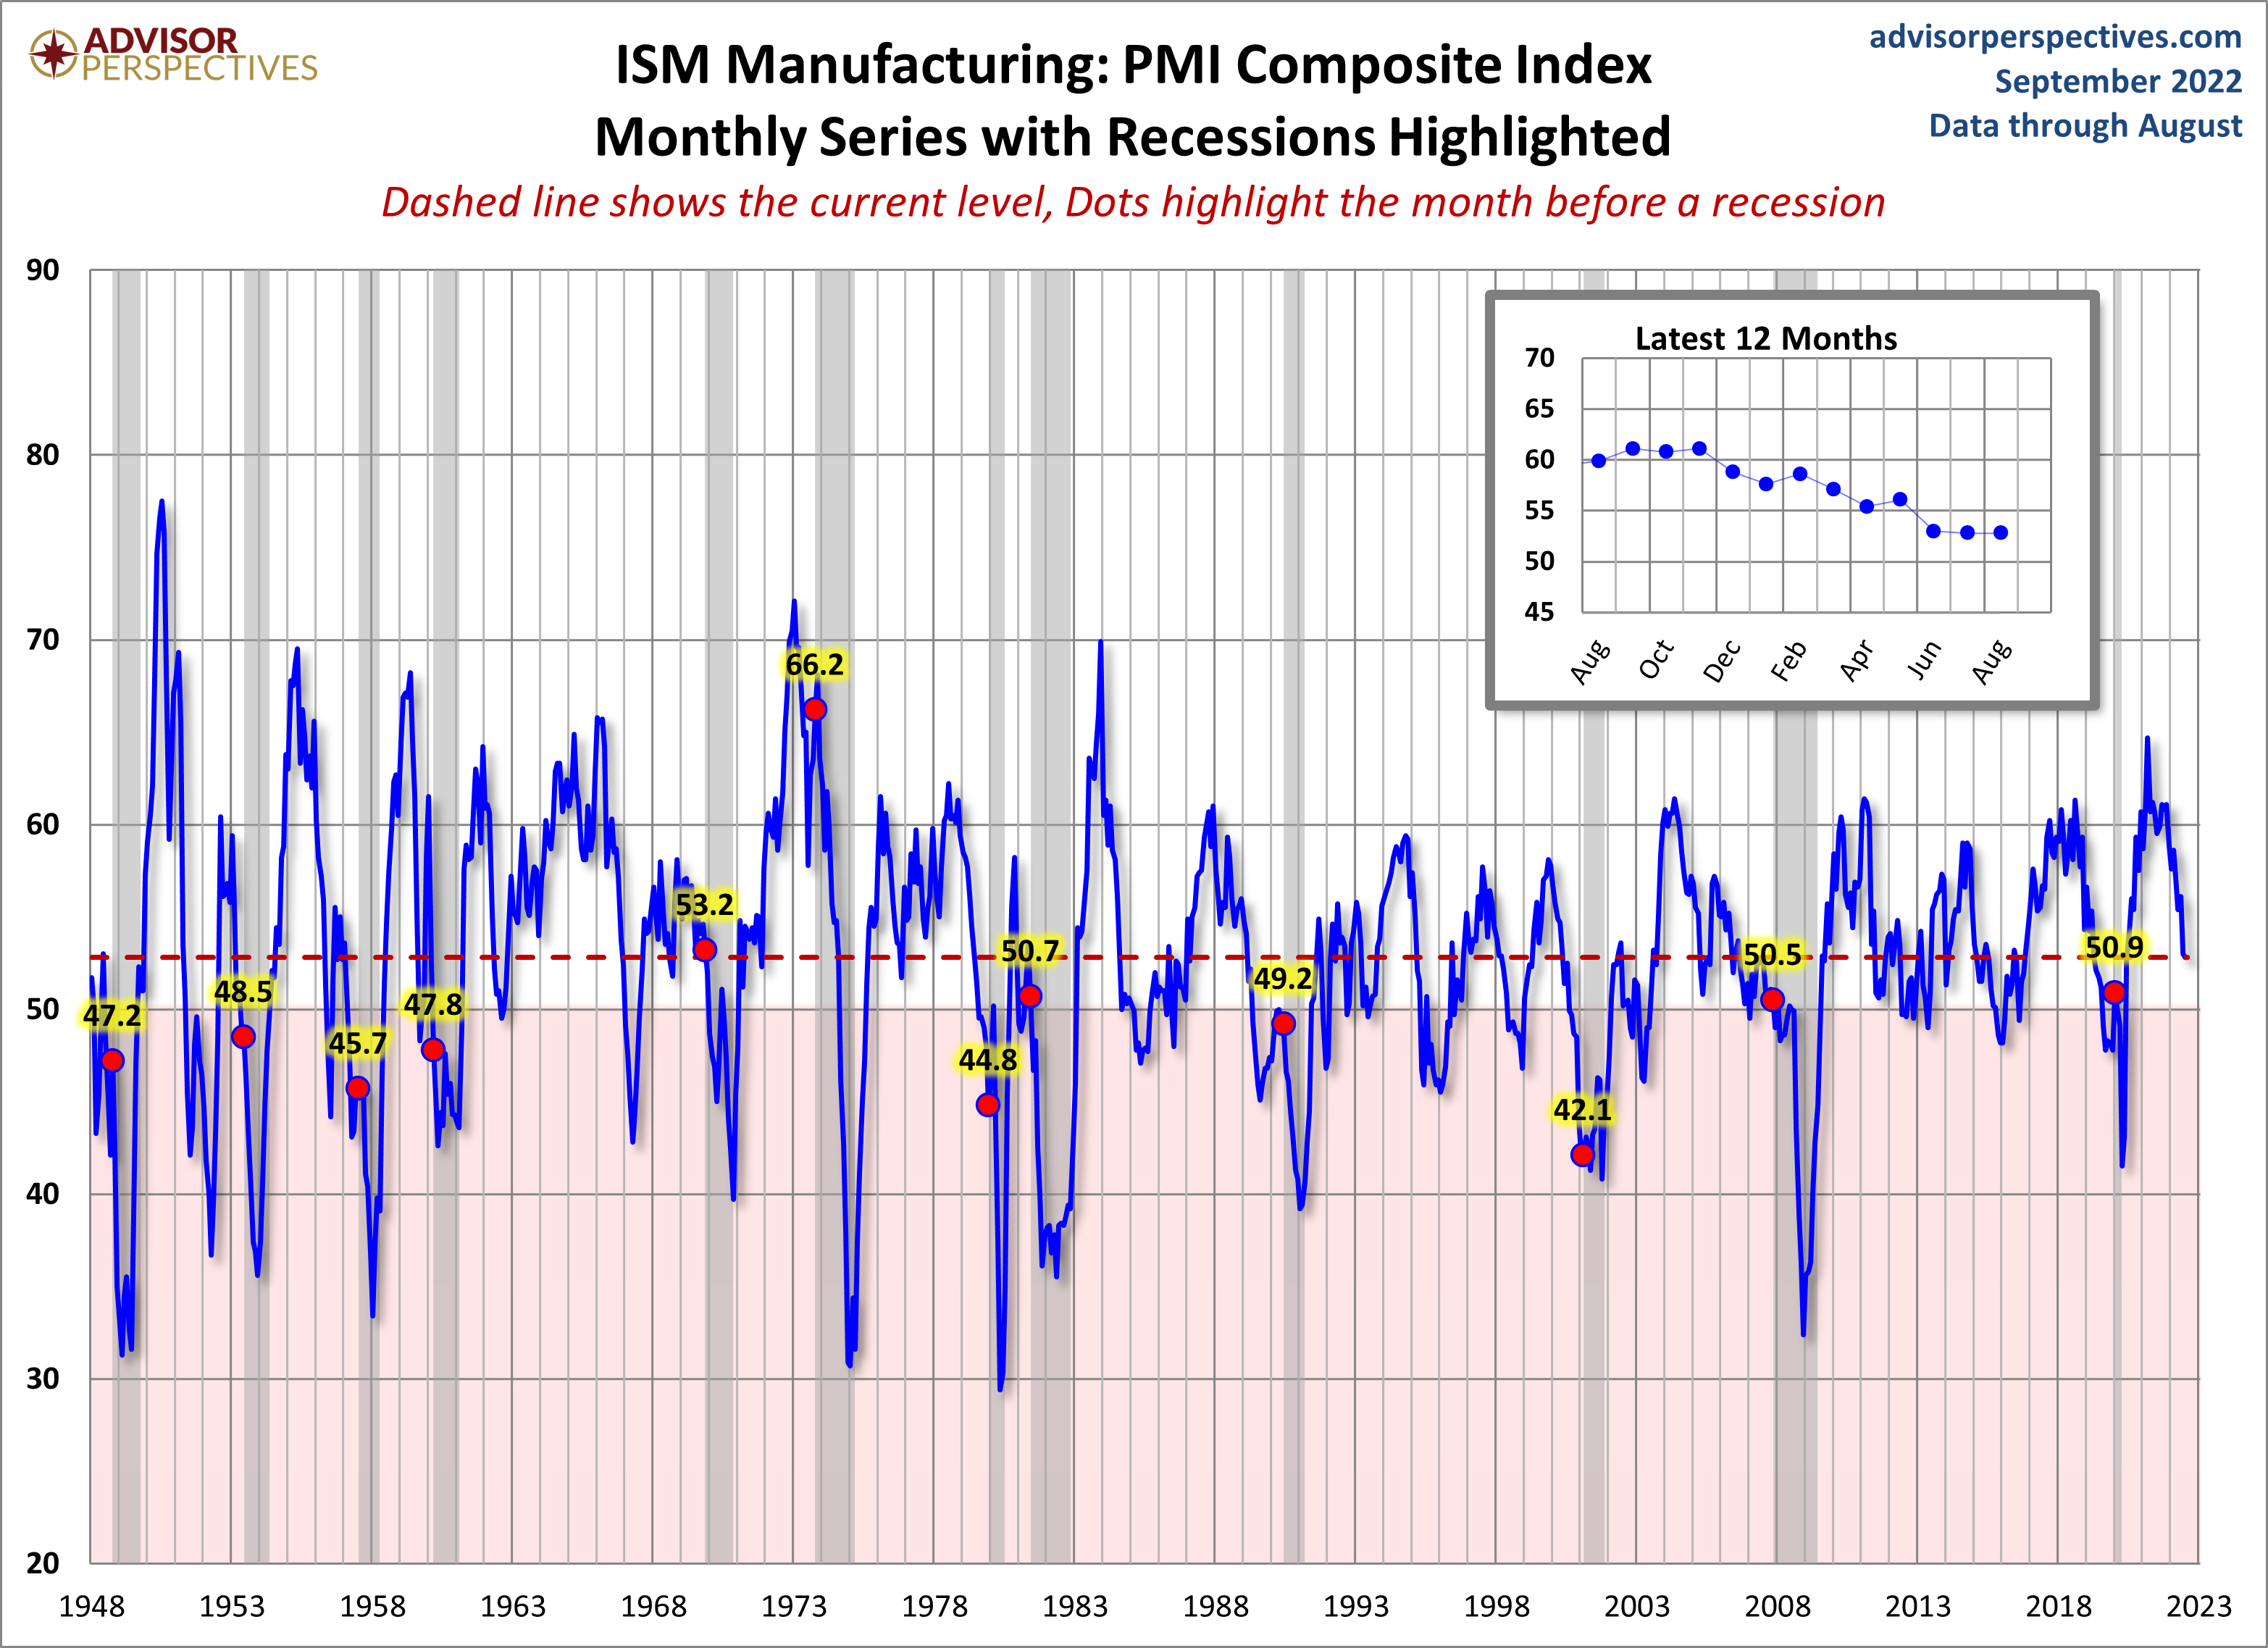
For comparison, here is the latest ISM Manufacturing survey.
(Click on image to enlarge)
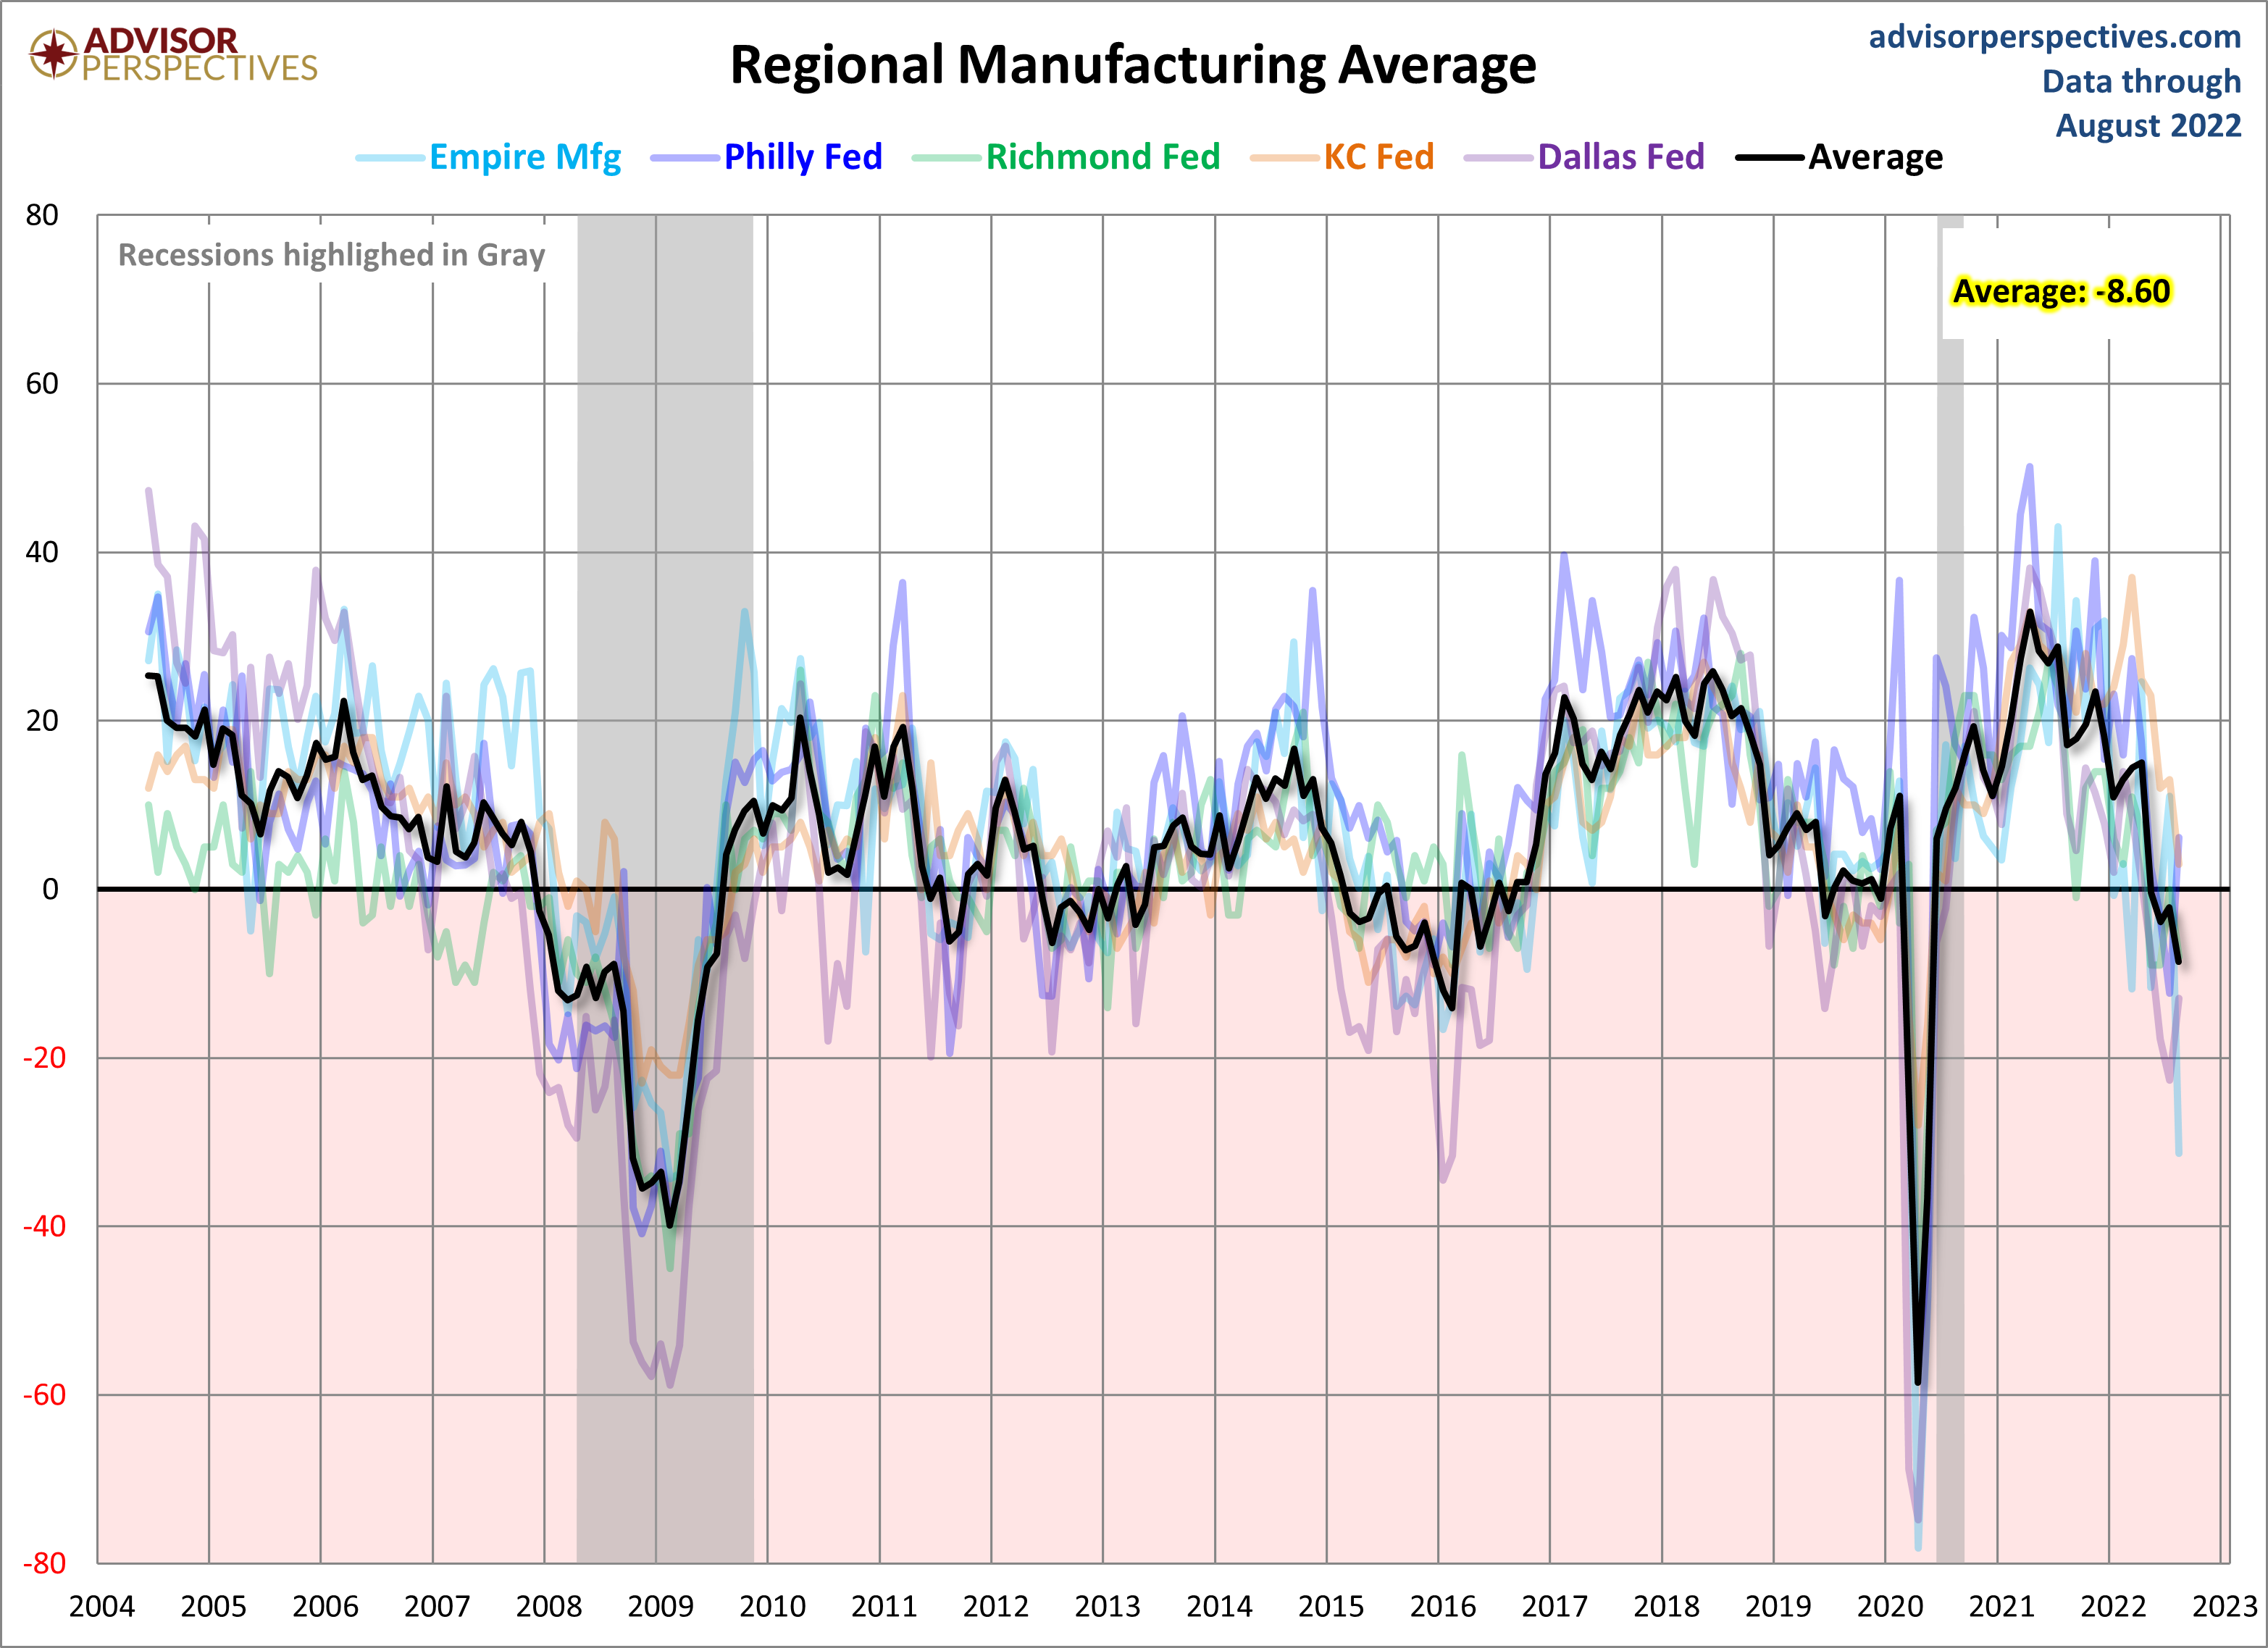
Let's compare all five Regional Manufacturing indicators. Here is a three-month moving average overlay of each since 2001 (for those with data).
(Click on image to enlarge)
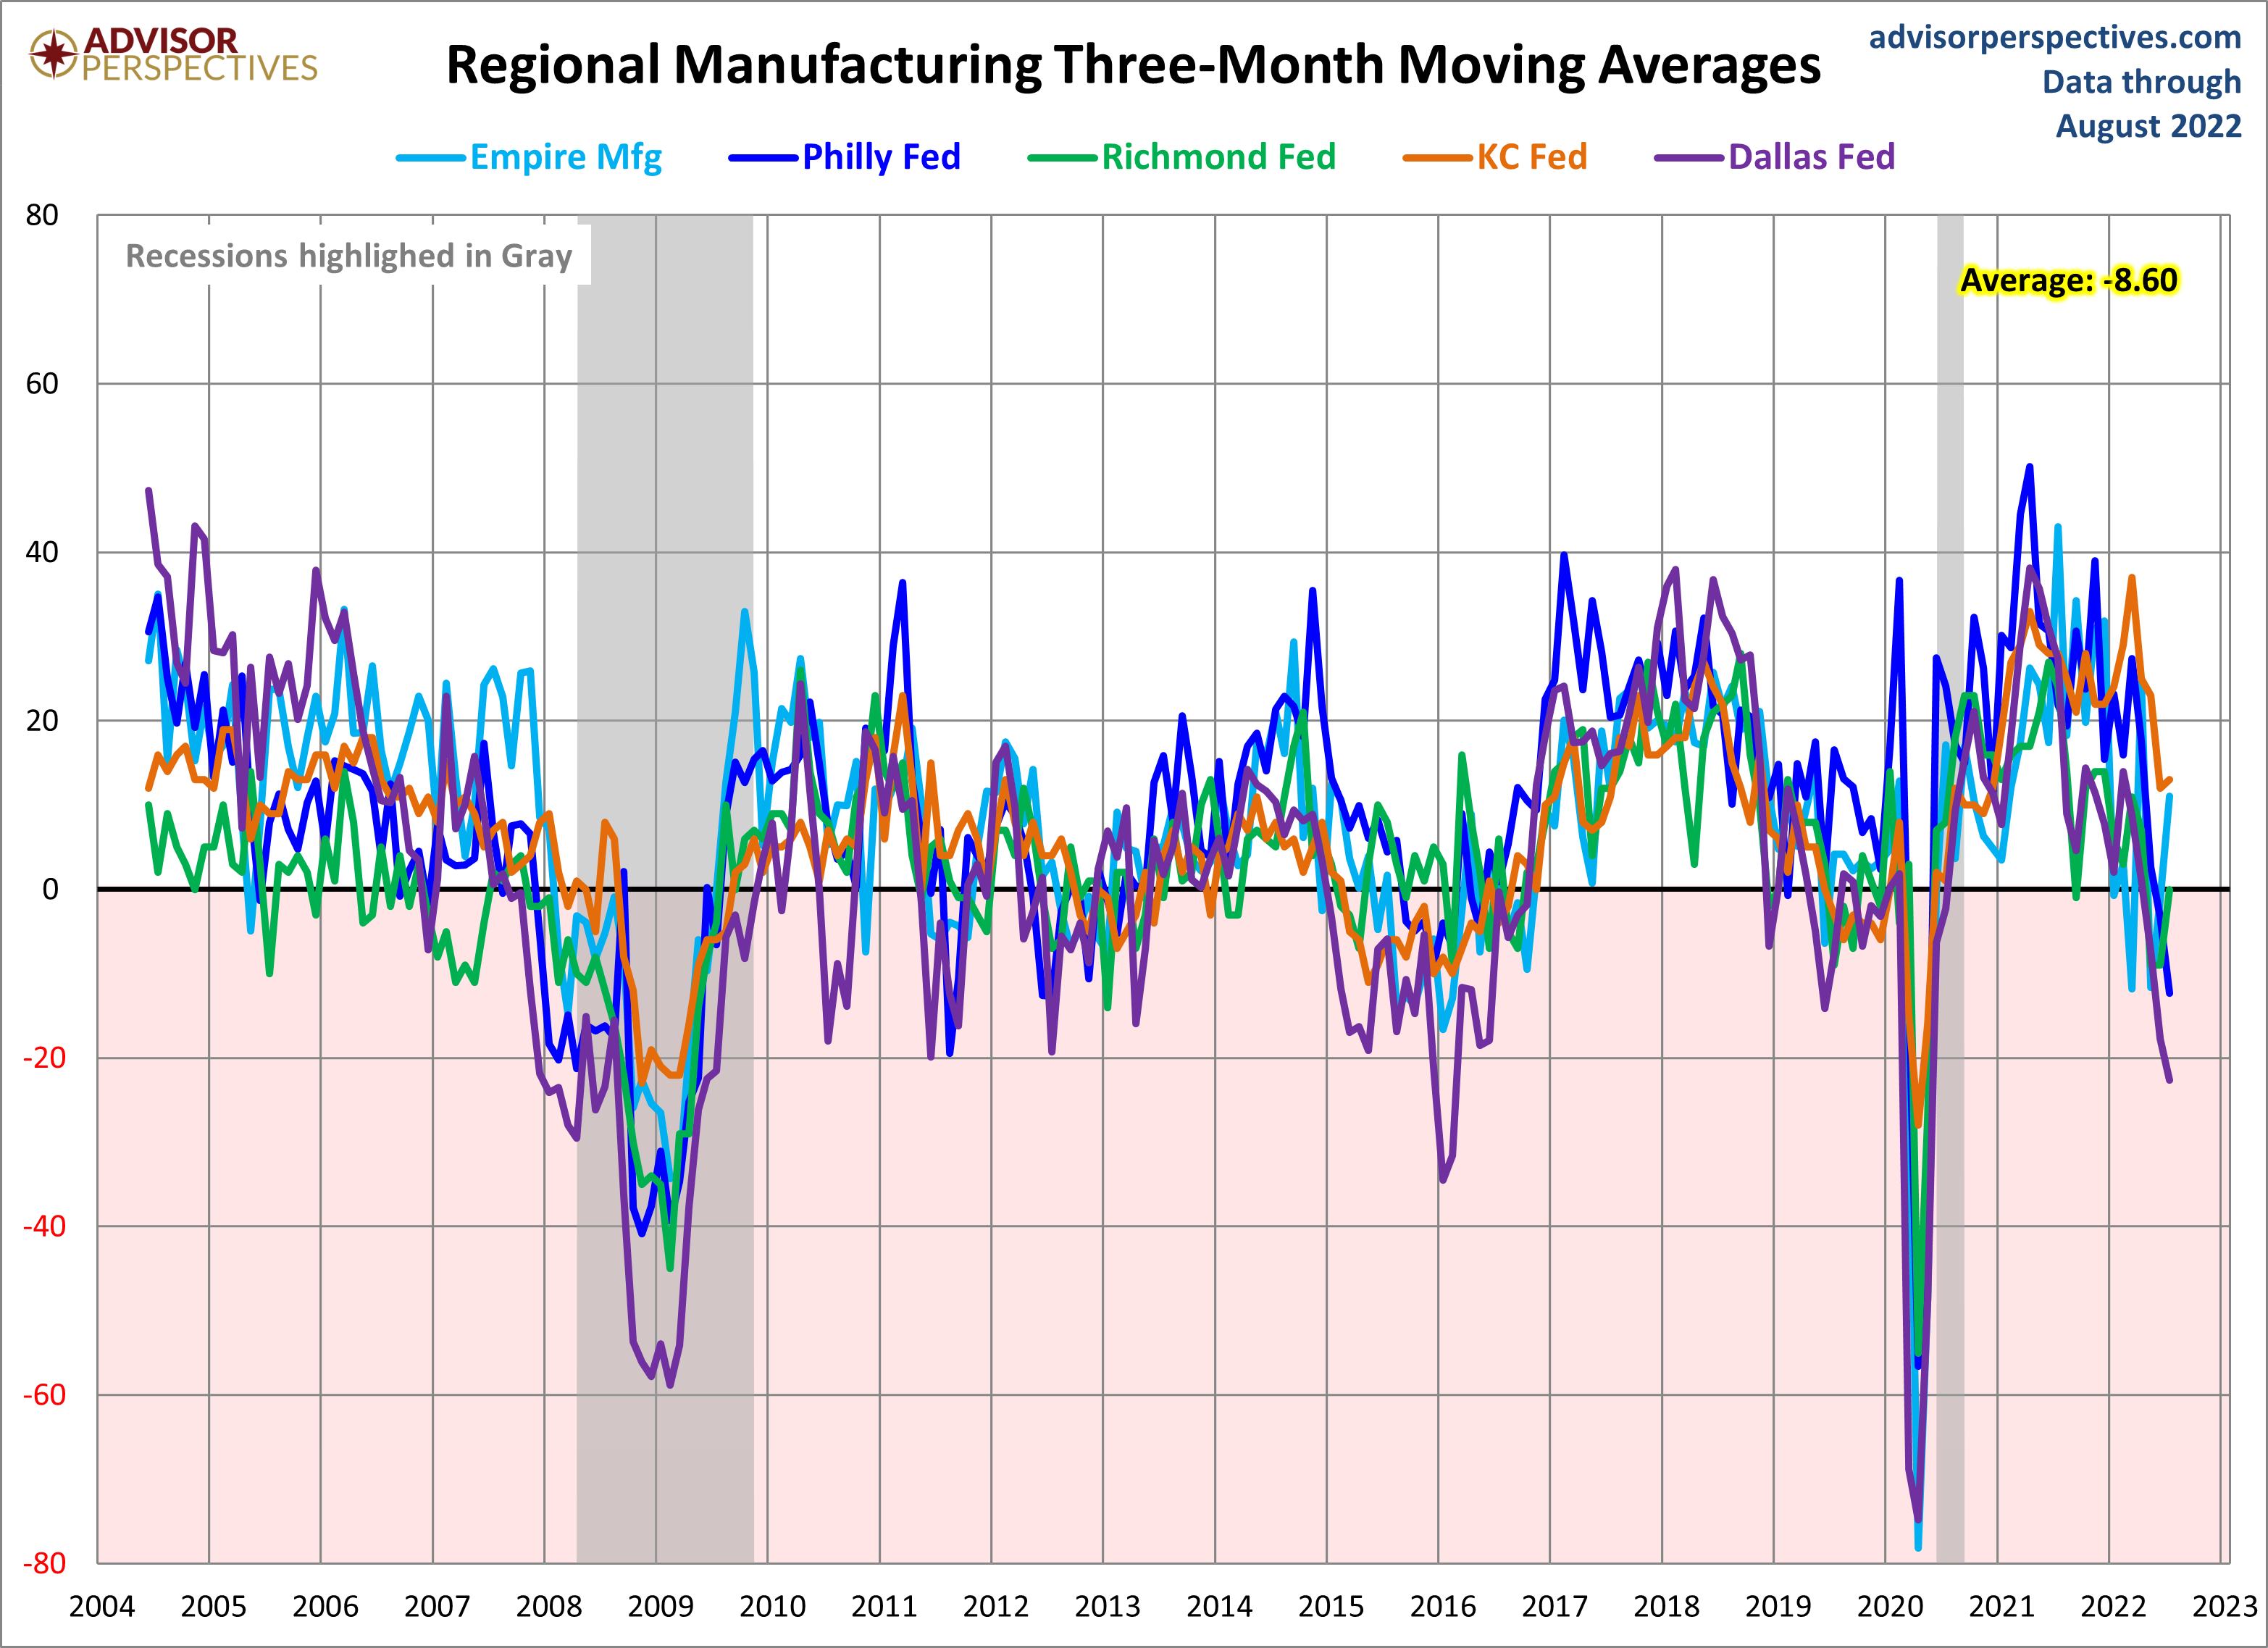
Here is the same chart including the average of the five for the latest month with complete data.
(Click on image to enlarge)
More By This Author:
Treasury Snapshot: 2-10 Spread at -0.51%S&P 500 Snapshot: Down 22.5% Year-To-Date
Underlying Inflation Gauge: August Update


Comments
Log in or sign up to join the conversation.