
Crude Oil's Important New Range – Weekly Market Outlook
Just when it looked liked the market was going to stumble over the edge of the cliff, the bulls backed away from a meltdown… and then some. After a nasty 3.5% pullback in the second full week of December, the bulls countered with last week's 3.4% bounceback, and tested new record highs in the process.
Do we trust last week's surprising strength as a renewal of the bigger-picture uptrend? We could, but a couple of red flags are waving we may want to at least look at before jumping on the bandwagon.
We'll weight the market's pros and cons in a moment. First let's paint the broad brush strokes using last week's and this week's key economic numbers.
Economic Data
We got a fair amount of economic information last week, not the least of which was the decision from the Federal Reserve to NOT change interest rates from their current uber-low levels. It does appear, however, the Fed realizes it can no longer kick the interest-rate-hike can down the road any longer.
The language describing how much longer the rate increase could be delayed was no longer the term "considerable time", but rather, is now described as "patient." Most interpreted the switch as a sign of it happening sooner than later, as much of the language accompanying the Fed's statement saw the U.S. economy in a positive light despite what was unfurling in Russia and eastern Asia.
Most of last week's economic numbers jived with Janet Yellen's slightly optimistic viewpoint.
Take, for instance, the increases in our nation's capacity utilization and industrial productivity for November. The former was up from 79.3% to 80.1%, and the latter was up 1.3%. Both are at multi-year high levels. We've previously mentioned that there is a correlation between this particular economic indicator and broad stock market performance.
Capacity Utilization and Industrial Productivity Chart
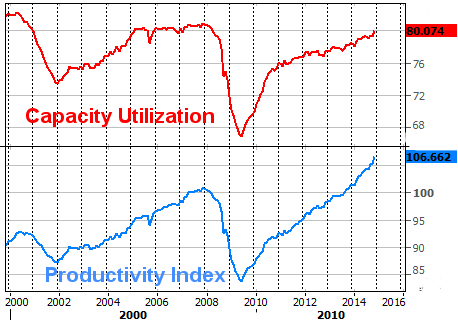
Source: Thomson Reuters Eikon
Housing starts and building permits came in fair. Starts fell from a pace of 1.045 million to 1.028 million, while permits slid from a pace of 1.092 million in October to 1.035 million for last month. Some of that lull can be blamed on the seasonal slowdown. Although both figures are supposed to be seasonally adjusted, that adjustment can't always wring out the winter building lull. Although neither piece of data is rising as rapidly as it was a year ago, both remain in measurable uptrends.
Housing Starts & Building Permits Chart
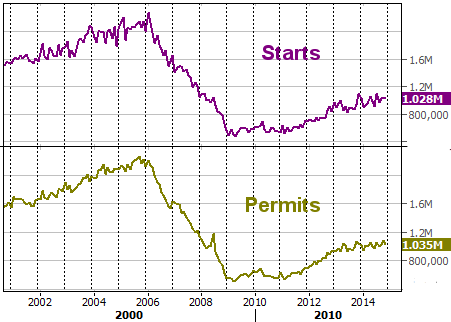
Source: Thomson Reuters Eikon
The only real economic worry we've got on the plat right now is a notable lack of decent inflation. The annualized inflation rate for consumers now stands at a mere 1.3% overall, and a still-tepid 1.7% without falling food and energy prices factored in.
Inflation Rate Chart
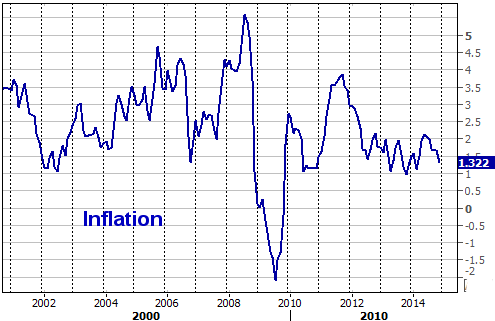
Source: Thomson Reuters Eikon
While Wednesday's comments from the Fed acknowledged the current inflation rate wasn't healthy, it also reiterated its expectations that inflation would return to healthy/normal levels next year, spurred by strengthening economic growth.
All the other numbers are on the following table:
Economic Calendar
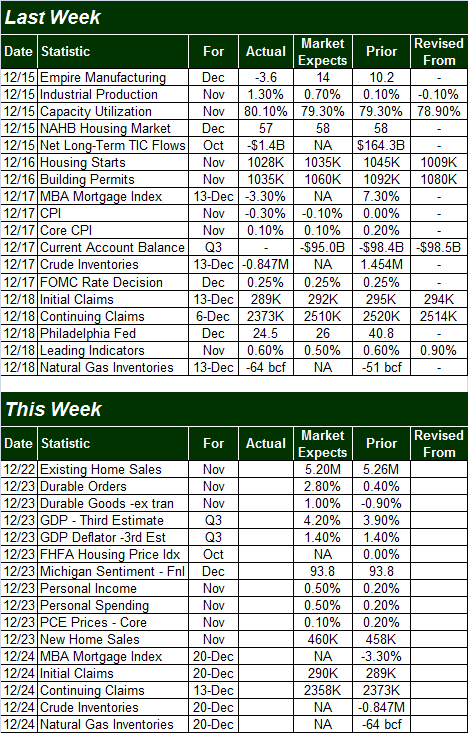
Source: Briefing.com
As you can see, this week is a big one for real estate and construction data.
Stock Market Index Analysis
To say last week was whippy for would be an understatement. Just inches away from becoming a full-blow disaster thank to Monday's and Tuesday's continuation of brewing weakness, stocks sidestepped an implosion thanks to a massive, Fed-inspired bounce on Wednesday and Thursday. The bulls followed-through a little on Friday, suggesting the bounce was the year deal. Yet…
The S&P 500 (SPX) (SPY) was short-term overbought again by Thursday's close – there's no arguing that. However, the market has been able to rally through overbought conditions plenty of times this year, so that in itself isn't an inherent reason to expect a pullback now. One red flag, however, is where the rally stopped and started to peel back on Friday. It was right around the 2075 level, where the index also topped out and then rolled over in early December. If investors have drawn a mental line in the sand there, thus new rally may have already run its course. But the overall momentum trend indicator picture remains positive for the time being.
S&P 500 & VIX – Daily Chart
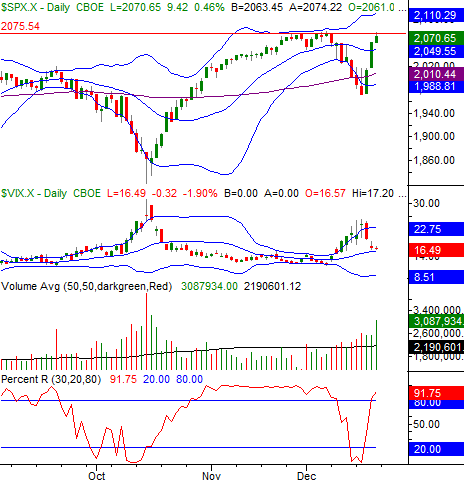
Chart created with TradeStation
The failure to take out 2075 on the SPX may have been nothing more than a coincidence. Traders still a little leery of adding new positions in front of a weekend, especially when they're overbought. Throw in the fact that Friday was also a major option expiration day, and it's possible trading was especially skewed.
The CBOE Volatility Index (VIX) (VXX) moved back below the 20 area to end the week – watch the key 16 level here as we head into a holiday-shortened time — the VIX staying above 16 & 18 would mean that concern remains present for option traders.
It remains to be seen what sort of mood investors are really in here; they'll tip their true hand here early this week. A move above 2075 should confirm the bullish undertow quite nicely though, setting up a potential move to the 2110-ish area where the upper 20-day Bollinger band currently lies.
It's a premise underscored by the longer-term weekly chart of the S&P 500.
In this timeframe we can see once again just how important the 26-week moving average line – the mid-line between the 26-week Bollinger band on this chart – is to the index. All it took was a brush of that line last week to spark a bounce the way we've seen it renew the rally several times since mid-2013. In fact, the only time we didn't see the 26-week moving average line stop and reverse a pullback was the dip from mid-October. We have to interpret this bounce at face value and assume it's a bullish clue, as was the case with the last ones.
S&P 500 & VIX – Weekly Chart
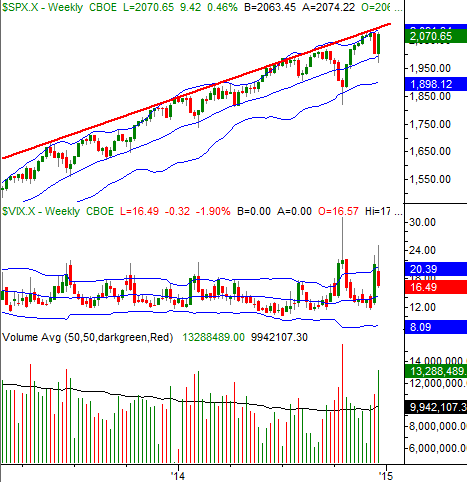
Chart created with TradeStation
The only thing to bear in mind with the weekly chart is the same worry the bulls may have with the daily chart – there's a ceiling not too far away. For the daily chart it's the upper band line around 2100, and for the weekly chart it's the long-term resistance line (red) that's also going to be around 2100 by the time it can be tested. Past that (and that's assuming the bulls get off to a good start this week), the weight of all the recent gains could begin to be a major burden again.
And of course, none of this bullish framework will matter if the S&P 500 can't hurdle the 2075 level. We can infer the current trend will make that happen, but until we see a really good thrust past 2075, it may be wise to play it close to the vest. If for some reason we see instead the indices slide back under the 20-day moving average line [for the S&P 500, that's 2050], we can look for at least a small downside move, perhaps starting with a retest last week's lows.
This week's first step is crucial for the bears and the bulls.
Chart of the Week: Crude Oil
It may be a bit premature to say with absolute certainty that Crude Oil (USO) has hit a major bottom and is now poised to rebound. But, it's not too soon to seriously consider the possibility. The chart of crude oil futures dropped some hints last week that the selling could be done. More important, it's established a ceiling and a floor that should act as triggers for the beginning of the next major move, whether it be up or down.
In simplest terms, last week, crude oil defined a floor around $54.25 and a ceiling around $59.30 per barrel. This is the most support and resistance we've seen for oil in months, and interestingly, we saw a spike in the number of daily contracts traded. Volume spikes tend to mark pivot points, telling us a flood sellers are getting out and/or a flood of buyers are starting to pour in. Tuesday's volume spike and the subsequent range-bound action between $54 and $59 is the biggest hint we've that the sellers aren't in 100% control here in a long, long time.
Crude Oil Futures Chart
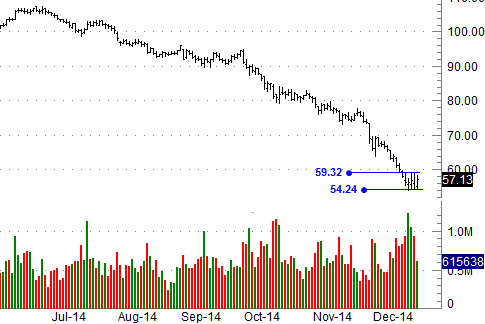
Chart created with Thomson Reuters Eikon
For oil, a break above last week's highs or a break below last week's lows is apt to represent the beginning (or a renewal) of a significant move.
Disclosure: None.


$XLE nice to know the buyers are in oil now.. we bottomed at 54. Price and volume say it all. As usual, ignore the news. Go long.
With wages low, housing sucks, Janet buys time..will NOT raise rates..market heal thyself is the mantra.
It does appear, however, the Fed realizes it can no longer kick the interest-rate-hike can down the road any longer. Baloney!