Crude Oil Tests Higher On Friday, WTI Explores Territory North Of $78.00
- Crude Oil markets are betting on seasonal demand increases to offset supply builds.
- Geopolitical headlines from the Middle East continue to put a floor under barrel bids.
- A split in demand growth projections has Crude Oil markets facing diverging outlooks.

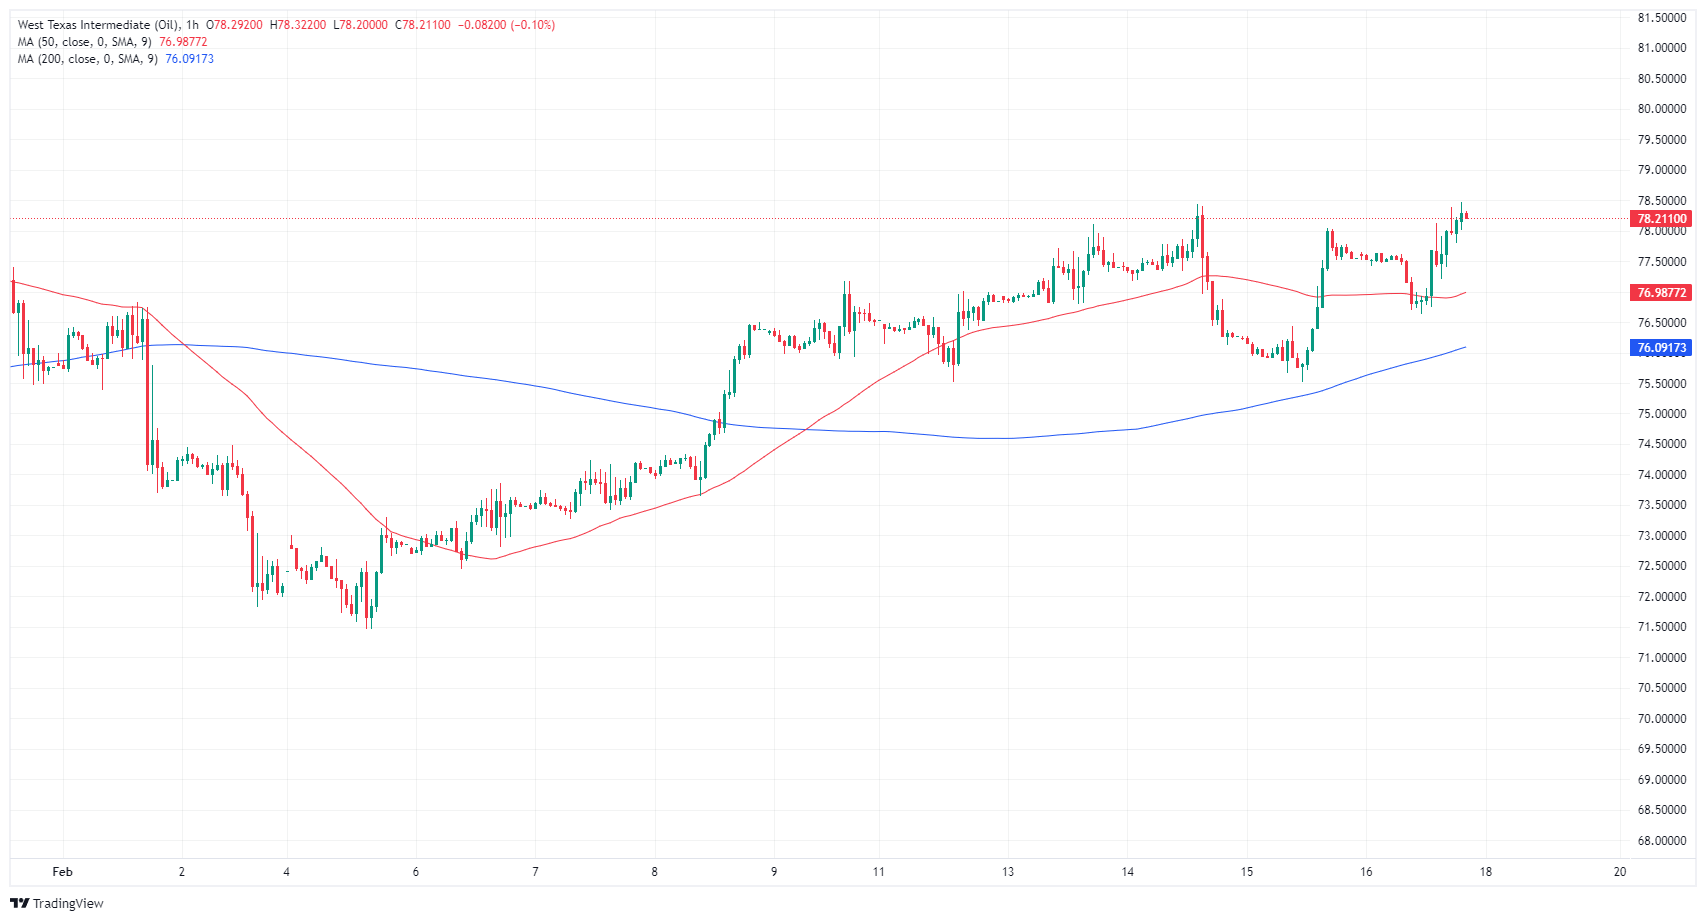
West Texas Intermediate (WTI) US Crude Oil extended a near-term rebound to claw back the $78.00 handle on Friday, driving back into a notable technical zone heading into Friday’s closing bell.
The Gaza conflict between Israel and Palestinian Hamas still hasn’t seen a resolution or significant progress on a hotly-negotiated ceasefire, keeping energy markets nervous about potential spillover into neighboring Crude Oil production-heavy nations like Iran. Houthi rebels in Yemen continue to target civilian cargo ships in the Red Sea bound for the Suez Canal, helping to keep fears of potential supply disruptions elevated.
The Organization of the Petroleum Exporting Countries (OPEC) firmly believes that global Crude Oil demand will continue to grow for the next two decades, but that perspective is being challenged by the International Energy Agency, which is forecasting that global demand will flag in the coming months. The IEA’s forecasts expect global Crude Oil demand growth to slow to 1.22 million barrels per day, while OPEC expects a long-term growth increase of over double that figure.
WTI US Crude Oil traders shrugged off the IEA’s warning flashed this week, as well as another surprise buildup in US Crude Oil barrel counts. Investors predominantly focused on geopolitical headlines this week, as well as a larger-than-expected drawdown in refined and downstream oil products.
WTI technical levels
WTI saw its highest bids in nearly three weeks on Friday, testing into $78.40 before wrapping up the week’s trading near $78.20 at Friday’s closing bell. Near-term momentum is healthily bullish with the 200-hour Simple Moving Average (SMA) climbing into $76.10 and bolstering intraday technical patterns from below.
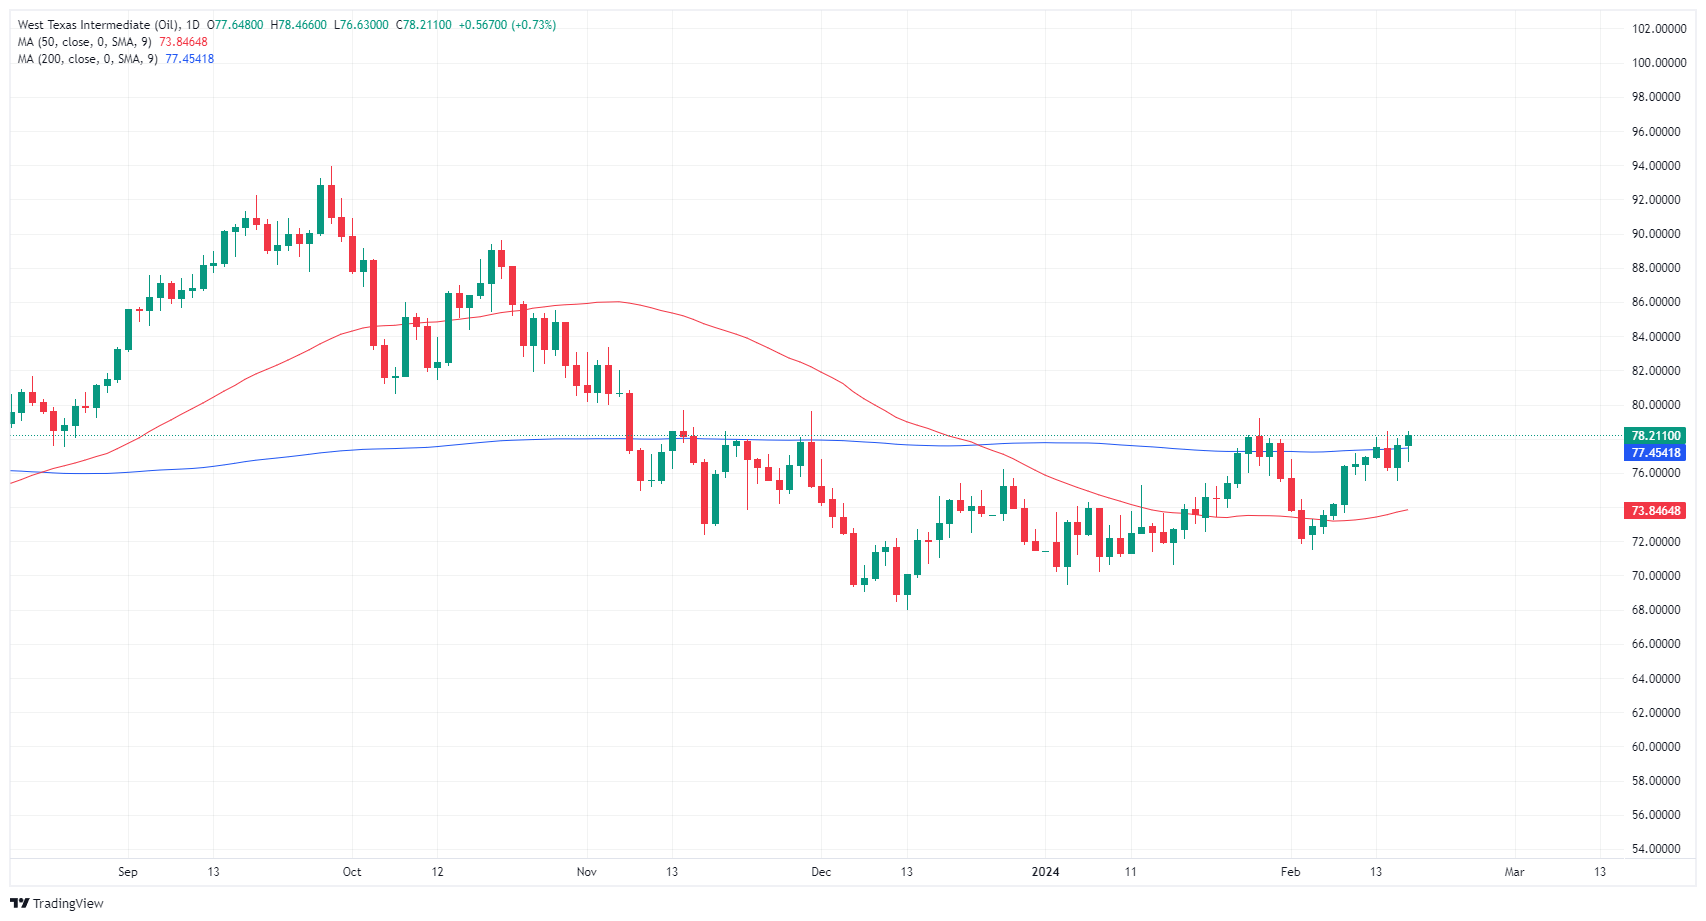
Daily candlesticks see WTI poised for a firm breakout to the high side of the 200-day SMA near $77.45, but bulls will need to stage a decidedly firm break of January’s peak of $79.20 before taking a run at the $80.00 handle.
WTI hourly chart

WTI daily chart

WTI US OIL
| OVERVIEW | |
|---|---|
| Today last price | 78.21 |
| Today Daily Change | 0.57 |
| Today Daily Change % | 0.73 |
| Today daily open | 77.64 |
| TRENDS | |
|---|---|
| Daily SMA20 | 75.58 |
| Daily SMA50 | 73.71 |
| Daily SMA100 | 77.02 |
| Daily SMA200 | 77.41 |
| LEVELS | |
|---|---|
| Previous Daily High | 78.05 |
| Previous Daily Low | 75.51 |
| Previous Weekly High | 77.18 |
| Previous Weekly Low | 71.46 |
| Previous Monthly High | 79.19 |
| Previous Monthly Low | 69.41 |
| Daily Fibonacci 38.2% | 77.08 |
| Daily Fibonacci 61.8% | 76.48 |
| Daily Pivot Point S1 | 76.09 |
| Daily Pivot Point S2 | 74.53 |
| Daily Pivot Point S3 | 73.56 |
| Daily Pivot Point R1 | 78.62 |
| Daily Pivot Point R2 | 79.6 |
| Daily Pivot Point R3 | 81.16 |
More By This Author:
Gold Price Forecast: XAU/USD Hit Three-Day High Amid Inflation ConcernsUSD/JPY Price Analysis: Held Above 150.00 Ahead Of The Weekend
EUR/USD dips as PPI signals extended Fed tightening
Disclosure: Information on this article contains forward-looking statements that involve risks and uncertainties. Markets and instruments profiled on this page are for informational purposes ...
more


