
Could GBP/USD Drop Despite A Weak U.S. CPI Report?
Photo by Colin Watts on Unsplash
The FX markets had been fairly quiet this week, until we saw a bit of volatility an hour or so ago with the release of a weaker CPI report from the US ahead of more data later in the week. The pound forecast is beginning to sour a little as the currency shows signs of vulnerability amid weakness in UK labour market, though more evidence of a slowdown is needed before the BoE hawks through in the towel. Today’s UK spending review was more or less a non-event for the pound. Meanwhile, US-China trade talks have offered little clarity so far, but there is optimism in the air this time around following marathon talks in London. All told, despite a weak inflation report, the US dollar is starting to look attractive again amid easing trade tensions, which may be bad news for the GBP/USD.
US-China talks keeping dollar bears at bay as CPI misses
So far this week the US dollar index had ambled rather than advanced. Reports of a fledgling “framework” sound constructive, yet Beijing’s reluctance to shrink its surplus hands Washington’s hawks plenty of ammunition to stall meaningful agreement. With traders unsure how far any London accord will reach, traders were largely sitting on their hands in the FX markets. That kind of changed when US CPI data came in weaker than expected. Economists were looking for a 0.2% month-on-month rise in headline CPI, with the core version seen rising 0.3% on the month.However, both versions were +0.1% month-on-month and that caused the dollar to slump across the board, lifting US index futures.
UK labour market weakness undermines pound
After an initial tumble in the GBP USD exchange rate to just shy of 1.3450 in response to yesterday’s disappointing UK wages and jobs data, the pound staged a spirited recovery, before fading into the close to ensure of a red close on the day as the US dollar found its footing across the board. However, those losses were mostly wiped out in reaction to the just-released US inflation data.
But will the GBP/USD turn lower again. After all, Tuesday’s data out of the UK was far from convincing. We saw the Average Earnings Index for the UK come in at 5.3% on a 3m/y basis, down from 5.6% recorded previously. The jobless claims data showed a 33.1K jump when only a small rise was expected. The underwhelming UK labour market data has bolstered expectations for a Bank of England rate cut in August, with a second move potentially on the cards in November, should incoming data allow. With rate cut probabilities on the rise, the pound’s four-month rally could be running out of steam.
For now, June remains in positive territory for GBP/USD, which raises the prospect of a fifth consecutive monthly gain. But that run may be living on borrowed time. Any further deterioration in UK data—or even a modest pick-up in risk appetite favouring the dollar—could well tip the scales back in favour of the greenback.
GBP/USD technical analysis and trade ideas
From a technical standpoint, the GBP/USD is holding onto key support levels for now, similar to the other major pairs. But the cable is beginning to look somewhat top-heavy. The key support zone between 1.3430 and 1.3470 (shaded in grey on the chart) has held up thus far, but a clean break below this region would mark a bearish shift in sentiment. Should that occur, a retreat towards the low 1.30s could swiftly come back into play.
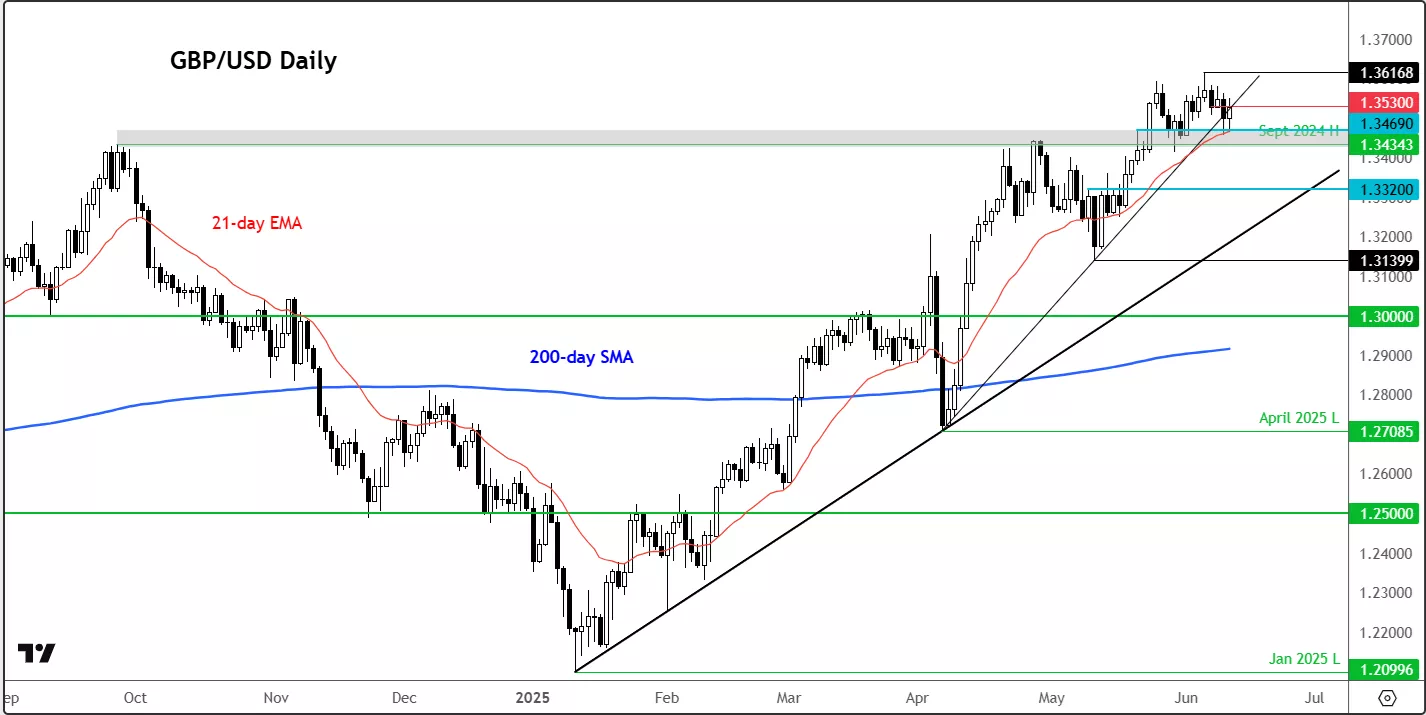
The next support area beath the 1.3430-1.3470 region is around 1.3320, marking the breakout area from the prior consolidation zone. Then the 2025 bullish trend line will come into focus next around the 1.3300-1.3330 area. The 12th May low comes in at 1.3140, beneath which there is not much further support seen until the psychologically important 1.3000 handle.
In terms of resistance levels, 1.3520/30 area is now a key short-term level to watch, marking the recent support area that gave way during Tuesday’s drop. Above that, 1.3600 is the next potential resistance.
Looking at the monthly chart of the GBP/USD, we can see that rates have now entered a massif region of resistance between 1.35 to 1.40.
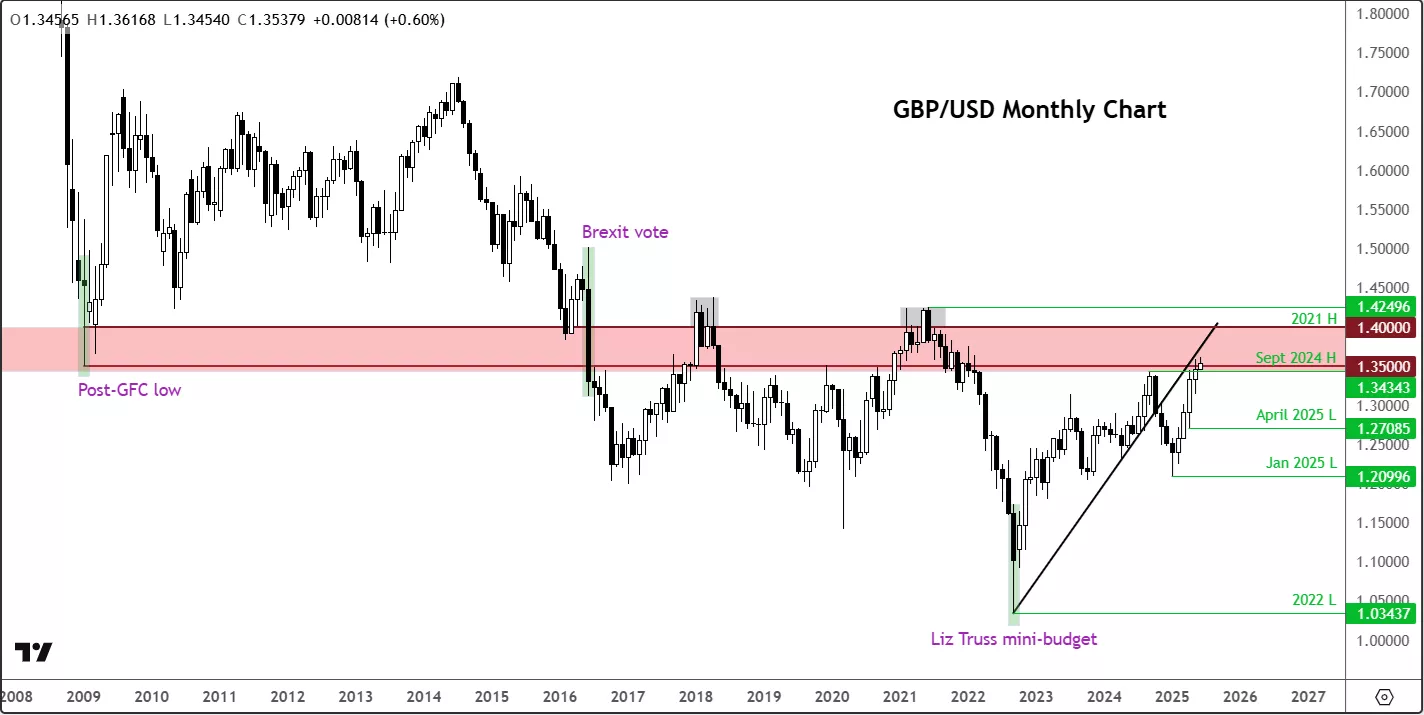
Since the post-Brexit breakdown below this 1.35-1.40 area, the cable has struggled to rise back above this zone on numerous occasions. This time, it is having another crack at it following a 4-month rally. Can the bulls manage a breakthrough this time around or will the bears prevail?
What happens here will have a big influence in the near-term direction. For example, a breakout above this key pivotal area could lead to further technical buying in the months ahead, while if we observe the formation of a bearish reversal here, then this could at least provide sizable drop, even if ultimately, we see a breakout later in the year.
More By This Author:
EUR/USD: Dollar In Focus Ahead Of Expected Trump-Xi Call, ECB And NFPGold Eyes Breakout Amid Renewed Trade War Tensions
Nasdaq 100: Nvidia Buzz Vs. Bond Market Blues


