

Alex Williams recently wrote “What Is ‘Core PCE Services Ex-Housing’ Anyway?,” which dissects the measure that the Fed is using to get a handle on “underlying” inflation. The most interesting bit (for me) is that about 1/4 of this measure is an imputed price index, based on wages. This means that this component will track wages (giving a convenient analytical relationship) by definition.
The logic of following this measure is that the Fed convinced itself that the core (ex-food and energy) personal consumption expenditure is the best measure of “underlying” inflation, but it turns out that the housing part of that has construction issues (too smoothed to pick up current events), and so they wanted to strip that out of the measure.
This measure is obviously problematic. Its use reflects intellectual herding: following the methodologies of previous academics, without stopping to ask basic “why are we doing this?” questions. This is a typical feature of areas of academic failure. Since it is impossible to come up with useful results, the “publish or perish” imperative means that what gets published are marginal changes to an existing literature that has serious defects. (Source for that assertion: what I saw in my career in academia.)
The Premise
The premise behind the search for “underlying” inflation is based on standard macroeconomic models. There is a single price level in the economy, and the theory tries to see what happens to that price level. Note that these “standard” models might either be (neo-)classical or heterodox aggregated macro models.
Probability theory is then used to tie the models to the real world: either there is a bit of randomness to the price level, the price level is observed with some random error, or possibly that observed prices for different goods and services randomly deviate from the “underlying” price. Since there are a lot of theoretical and empirical papers out there, it would take a lot of research effort to try and come up with a clean mathematical characterisation of all these possibilities.
(Note that “big data” models might attempt to wrestle all observed prices into a single ball of equations. These are not what I have in mind for “standard” models.)
The problem that this theoretical approach faces is that we cannot measure this single price level, rather we measure prices of particular goods and services. To add insult to injury, canny capitalists keep changing the mix of goods and services. For example, buying breakfast cereals is a constant game of changing box sizes, while toilet paper producers have created a new branch of integer mathematics (packaging exclaims “12=24”!)1.
Statistical agencies were tasked to convert these observed prices into price indices. This then implied a lot of fieldwork, and the creation of models to back out indices based on the measured data. Since the actual input prices are not published, people have come to view the output of index calculations to be a true measured value and not a model output. However, the problems in the housing components is an ugly reminder that it is a model output, and not necessarily reflecting “true economic reality.”
Underlying Inflation Versus Price Indices
The immediate problem for mainstream economists is that their models are built on the assumption that real interest rates are what drive the economy — it is assumed that the trade-off between present and future consumption is what drives economic decisions. The real interest rate is implicated because households will invest at the nominal rate but the future cost of goods increases by the expected inflation rate. Therefore, the real interest rate determines the exchange ratio between present and future consumption.
The reason that this is a problem is that observed aggregate inflation rates — as proxied by the headline CPI or PCE — is erratic. Although we are supposed to be using expected inflation, the expected inflation rate needs to be somewhat close to realised inflation for the theory to have any real-world significance.
The solution is to come up with an “underlying” inflation measure, that removes the “noise” from observed inflation. We have a few ways of doing this.
-
Smooth headline inflation. The problem is that smoothing is going to be an approximation of a low-pass filter, which introduces lag. This was how “adaptive expectations” were calculated.
-
Throw out components of the inflation index that are deemed to be too volatile. Thus we get core inflation, and modern offshoots, like “core services ex-housing.”
-
Throw out “outlier” price changes for index components each period, giving us something like median CPI inflation (and offshoots). This method “feels more scientific,” but we might have problems if a component with a large weighting — e.g., housing — is acting in an unusual fashion.
All of the above techniques is justifiable — and I have used them all. However, they are all predicated upon there being a single “underlying inflation rate” that statistical manipulation of price index is trying to uncover. If the “best model” of the economy is that there are multiple “underlying components” for measured prices, no single variable can hope to capture that dynamic. For example, look at the long-running gap between services and goods price indices in the United States.
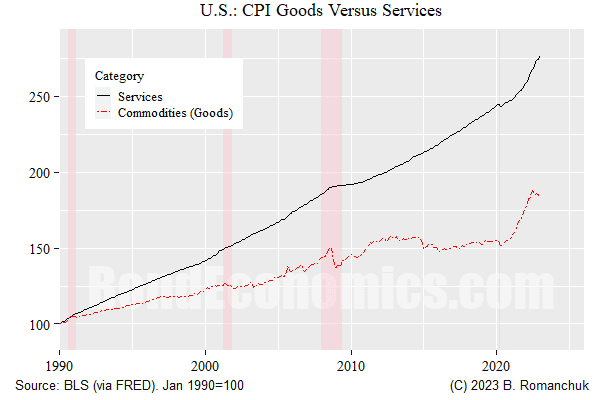
The figure above shows the divergence in the levels of the commodities sub-groups (goods) of the CPI versus the services sub-groups since 1990 (the series were rebased to 100 at that point). We see that the price level of services out-stripped goods over that period, with lower volatility. I would assert that just eyeballing this chart tells us that there is no plausible mathematical formulation where monthly services and goods inflation are generated as zero-mean random deviations from a single underlying price level.
Aside: I Do The Same Thing
One might assume based on my tone herein that I do not make the analytical mistakes above. That is not really true; I probably have am embedded assumption that there is a single “underlying trend” to price pressures in my writings. However, I had wrangled enough with CPI data and economic models to have built up a healthy skepticism about our ability to model them using aggregated models. Anyone who needs to forecast headline CPI — to trade breakeven inflation — is going to be aware that the various components do their own thing.
Alternatives?
I have little doubt that most people want to assume that there is a single underlying price factor within the economy, driven by something like the output gap. We just need to keep in mind that measured data is not going to track that underlying factor, we can only hope to statistically estimate it. We also need to keep in mind that not all prices in the economy will follow that factor.
The theoretical justification for the previous relies on two premises, lying on each side of the supply/demand curve. On the supply side, wages are the major domestic input cost for businesses. To the extent that wages move together, businesses face a common domestic cost factor. On the demand side, relative price changes will presumably have an effect on demand for particular goods and services, allowing price impulses in one area to to be distributed to others. However, these factors do not preclude deviations between sub-indices, which is going to mess up statistical estimation of a single price factor.
On the analytical side, the absolute minimum we need to do is decompose energy prices from aggregate prices. Our ability to do so is limited by energy being an input cost to other prices. Nevertheless, this is the argument for using something resembling core inflation — although the exclusion of food prices from “core” is suspect. If we want to forecast inflation, we need to forecast those two components.
To move beyond that, we need to look at all the components of the price index and see how they are acting.
If we are not attempting to model inflation, we can look at the index sub-components, and track them individually. (We need to also keep in mind index weights and the contribution to index volatility — a non-volatile component with a weight of 1% should not be of particular concern.) The trap with doing this is “duelling chart pack risk”: human nature leads to people cherry-picking the sub-indices that are following the path that matches a person’s pre-conceived views. This tendency is easily demonstrated in looking at popular inflation commentary — finding sob stories about some random good or services is a trivial exercise.
Throwing out components of the CPI because they are affected by “one-time factors” can easily turn into a more sophisticated version of cherry-picking. There are times when we need to do this — a tax change might blow up a particular CPI component, and so we want to abstract away from that change. However, one can argue that some of the inflation complacency after the pandemic was the result of too aggressive waving away of “distortions.” (I had sympathies with Team Transitory, but I was not exactly happy with that tendency.)
To move beyond cherry-picking, one needs to be disciplined and attempt to model the (major) components of the price index. (I am writing primers and not selling forecasts, so I do not attempt to do this. Such sub-component models are always somewhat sketchy and need continuous maintenance.) In the United States, you need to at least go after energy, housing, major “administered” prices like medical expenses and education, and then goods and services — each of which might be broken down (e.g., breaking out autos). To the extent that something like the output gap shows up in the model, it might feed into the non-administered prices that are not driven by global energy prices.
Doing this would have led to much better analytical outcomes after the initial pandemic wonkiness subsided. When looking at U.S. CPI, the main source of big forecast misses after the initial price surge was housing, with its high index weight. If you got housing right, you probably would not have missed the overall ex-energy index by much. And if you got the housing forecast wrong — you know the major contributor to your blown forecast. (I never had too much confidence in predicting the housing component of CPI, historically it was too non-volatile to fit dynamics to it.)

Nevertheless, I have serious doubts that models would have weathered the initial pandemic disruption period well. For example, it would have been very unlikely that a model built before 2020 would have captured the surge in used car prices (above). Although having a sub-standard used car price model would not normally be that disastrous, when a component has a 40% inflation rate, it is going to make a decent contribution to overall CPI. The realistic attitude was that any model output should have had very large error bars put around it in that era, given the unusual disruptions to activity. Models would have to patched in reaction to the disruptions as best possible.
Longer-Term Forecasting
Component-based inflation models are generally going to be aimed at relatively short horizons. Once we are at a 2-year horizon (for example), we are probably going to have to assume that short-term effects will wash out, and then we can use a more generalized model — such as one using the output gap. Central banks have done similar exercises in the post-1990s inflation-targeting era, and results were generally reasonable.
However, we have discovered that this success was largely a function of fairly stable core inflation, and most non-energy components of CPI had relatively moderate price swings (when compared to earlier eras, or after 2020). Even if highly aggregated approaches are still the best way forward for such horizons (I do not have a strong argument against that assertion), if pricing is highly disrupted, we do not have a great feel for what the “current” situation is. Meanwhile, the construction method for housing embeds a long lag, so it will have an effect on a 2-year horizon if the component is moving.
Concluding Remarks
The best way to be misinformed about inflation is to read the market or popular economic commentary, given the amount of cherry-picking that is on display. At the minimum, you need to get your hand on as many price charts as possible so that you have a better idea of the overall picture, and not the subset of charts someone with an analytical agenda is pushing on you.
More By This Author:
MMT And BankingThe Return Of The Debt Ceiling (Again)
Basis Point Usage

Comments
Log in or sign up to join the conversation.