
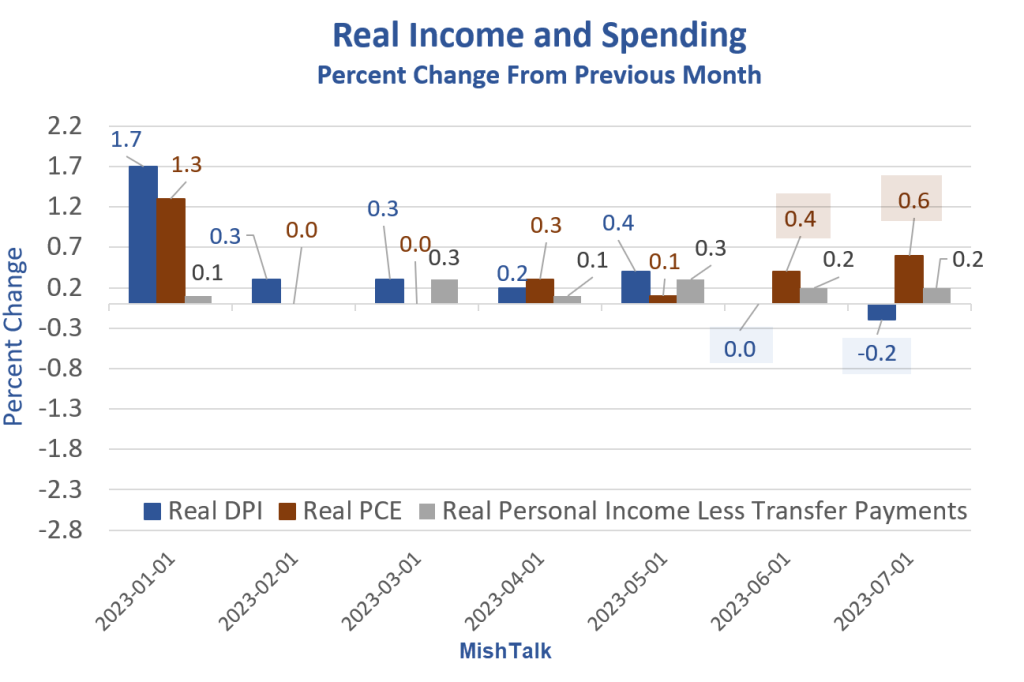
Real PCE and DPI from the BEA, chart by Mish. Disposable means after taxes.
The BEA’s Personal Income and Outlays report for July shows consumers picked up the pace of spending for the second month.
Key Income and Spending Points
- Disposable (after tax) Personal Income (DPI) was flat in July.
- Adjusted for inflation, Real DPI fell 0.2 percent.
- Personal Consumption Expenditures (PCE) jumped 0.8 percent in July.
- Adjusted for inflation, PCE rose 0.6 percent.
- Real means adjusted by the PCE price index as measured by the BEA.
- Personal Current Transfer payments (PCTR) primarily includes Social Security, Medicare, Medicaid, and Food Stamps.
Price Indexes
- The PCE price index and Core PCE (excluding food and energy), both rose 0.2 percent in July.
- Compared to a year ago, the PCE price index rose 3.3 percent, an increase of 0.3 percentage points from June.
- Compared to a year ago, the Core PCE price index rose 4.2 percent, an increase of 0.1 percentage points from June.
Personal Consumption Expenditures

Those are nominal numbers. Inflation-adjusted, spending rose 0.6 percent in July and 0.4 percent in June as the lead chart shows.
Consumers has gone on a huge spending spree in the last two months.
Personal Income Five Ways Plus Taxes

Personal Income numbers from the BEA, chart by Mish
The three rounds of fiscal stimulus are easy to spot in the top three lines.
PCTR stands for Personal Current Transfer payments. PCTR primarily includes Social Security, Medicare, Medicaid, and Food Stamps.
Personal income has steadily increased. Real disposable income is another matter.
Real DPI minus PCTR was $12.361 trillion pre-pandemic, February of 2020. It’s only $12,491 Trillion now.
Real PI minus PCTR was $14.415 trillion in February of 2020. It’s only $14.769 trillion now. That’s a total rise of 2.4 percent over 3 and a half years.
This is the measure the NBER watches to determine reaccessions. Real income has stagnated. This suggests the income view of recessions is the correct view.
Negative Revision to 2nd Quarter GDP, Huge Discrepancy with GDI Continues
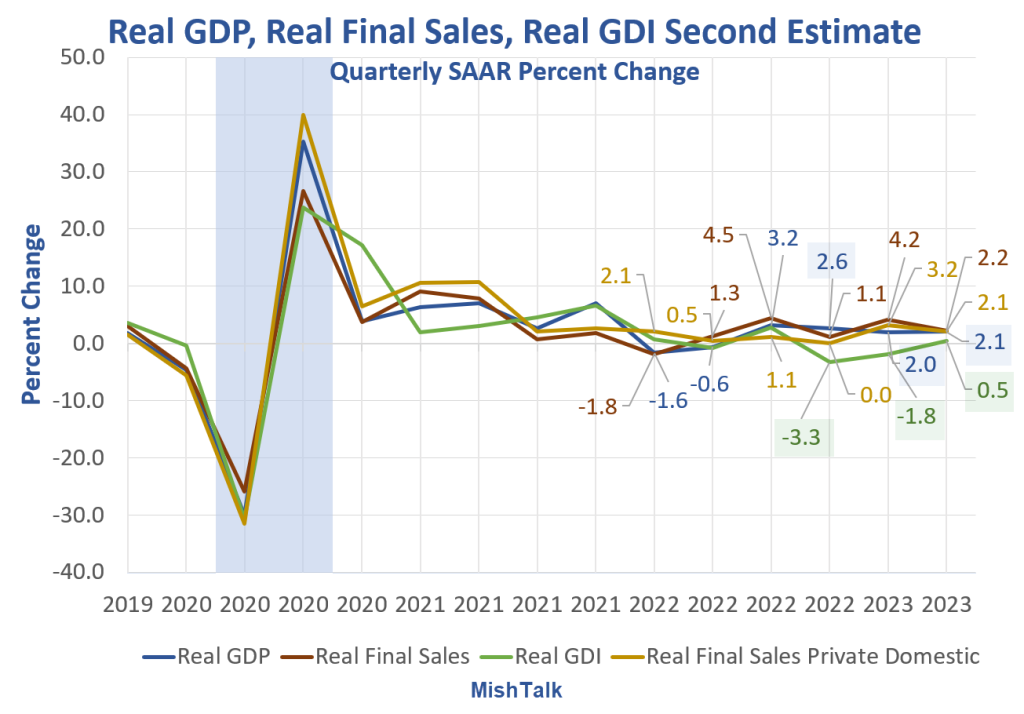
GDP numbers from the BEA, chart by Mish
GDP vs GDI Chart Notes
- Real means inflation adjusted
- GDP is Gross Domestic Product
- GDI is Gross Domestic Income
- Real Final Sales is the bottom line assessment of GDP. It excludes inventories which net to zero over time.
Major Discrepancy Between GDP and GDI
GDP and GDI are two measures of the same thing, one from a product perspective, the other from an income perspective. Over time they merge.
The last three quarters of GDP starting with 2022 Q4 are 2.6 percent, 2.0 percent, and 2.1 percent. The last three quarters of GDI starting with 2022 Q4 are -3.3 percent, -1.8 percent, and 0.5 percent.
GDI is still consistent with a recession starting 2022 Q4. GDP isn’t. The NBER, the official arbiter of recessions, averages the two measures. The result is inconclusive for Q4 and Q1 combined.
For discussion, please see Negative Revision to 2nd Quarter GDP, Huge Discrepancy with GDI Continues
Philadelphia Fed GDPplus Measure Sure Looks Like Recession Started in 2022 Q4
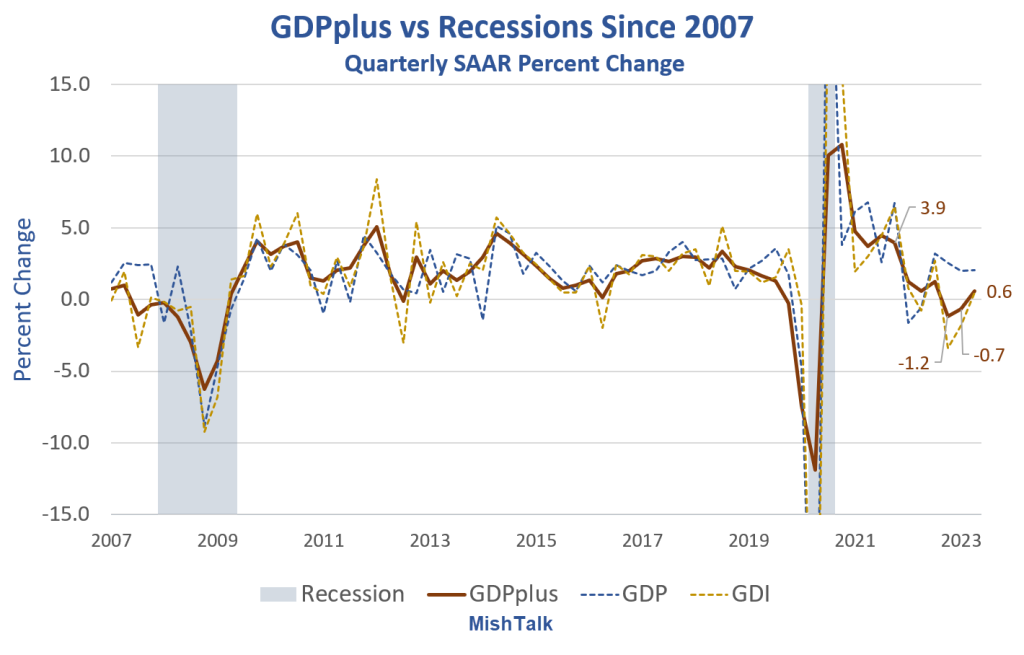
Data from Philadelphia Fed, chart by Mish
GDPplus is a measure of the quarter-over-quarter rate of growth of real output in continuously compounded annualized percentage points.
It’s a blend, but not an average, of Gross Domestic Product (GDP) and Gross Domestic Income (GDI). It is much smoother than either GDP or GDI as the above chart show.
GDPplus vs Recessions Since 1960
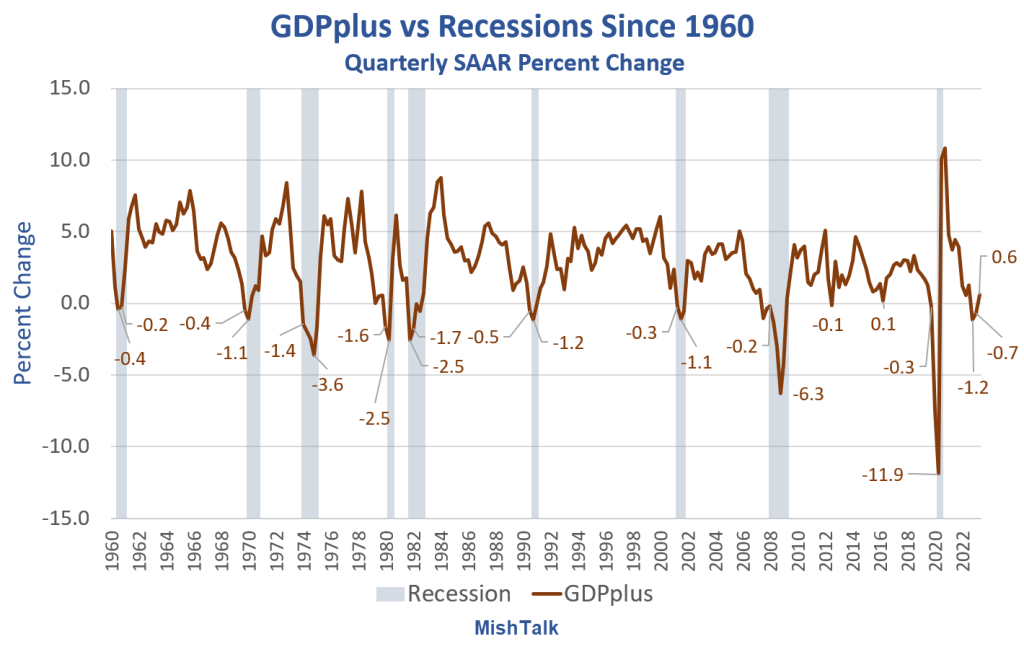
In 100 percent of the cases, with no false signals, no misses, and no lead times more than two quarters, every time GDPplus had two consecutive quarters of negative growth, the economy was in recession.
GDPplus and GDI were both negative for two consecutive quarters starting fourth quarter of 2022.
For more charts and discussion, please see Philadelphia Fed GDPplus Measure Sure Looks Like Recession Started in 2022 Q4
The deeper one looks, the more likely it appears that GDI and GDPplus offer a better take of the economy than GDP.
More By This Author:
Philadelphia Fed GDPplus Measure Sure Looks Like Recession Started In 2022 Q4Negative Revision To 2nd Quarter GDP, Huge Discrepancy With GDI Continues
The Labor Leverage Ratio, A Measure Of Wage Bargaining Power, Is In Retreat


Comments
Log in or sign up to join the conversation.