
Comparing 2015 To Past Market Bottoms
Heading into trading on September 16, 2015 the S&P 500 was 14 trading days removed from the August 25 low. From a trend perspective, how does the current market compare to past market bottoms, assuming we examine those charts 14 trading days after a low or retest of a low?
Our objective is to compare today’s market to favorable and lower volatility entry points that followed past market corrections. If a market bottoms, but remains highly volatile for six weeks while making little progress, cash really isn’t missing much other than additional sleepless nights stemming from wild intraday and intraweek swings up and down.
We will start with the present day chart. Notice how far price is below the daily moving averages; think “how much white space is between the market and the moving averages?” In the present day case, the answer is “a lot of white space.” The moving averages are all sloping down, telling us the bias from a trend perspective remains down until proven otherwise.

1987 – A Lot Of White Space
Notice in the early stages of the 1987 crash/correction (see October 19), there was also a lot of white space between the market and the moving averages (similar to 2015). Typically, not always, a market that has seen such a sharp plunge away from the moving averages takes time to repair itself and form a bottom, which is exactly what happened in 1987. It took several weeks for price and the moving averages to “reduce the white space”. Once price moved back toward the moving averages, it told us the odds of a permanent bottom forming were higher. Everything we do with charts speaks to probabilities, not predictions or certainties.

The chart above tells us it may take time for the present day market to form a sustainable bottom.
1990 – It Took Time To “Close The White Space”
In the early stages of the 1990 correction below, like 2015, the market and moving averages were separated by white space. Similar to the bottoming process in 1987, it took time for stocks to close down the white space in 1990 and set the stage for a sustainable push higher.

1994 – Waterfall Plunge
Keeping in mind the historical charts are showing us what it looks like 14 trading days after a favorable risk-reward and lower volatility entry point, which means if we extended the historical charts into the future, things got much better for the stock market bulls (lower volatility and sustainable gains followed). When we view the charts, the purpose is to ask “does the 2015 chart look like the favorable entry points shown in the historical charts?….How are they similar?….How do they differ?
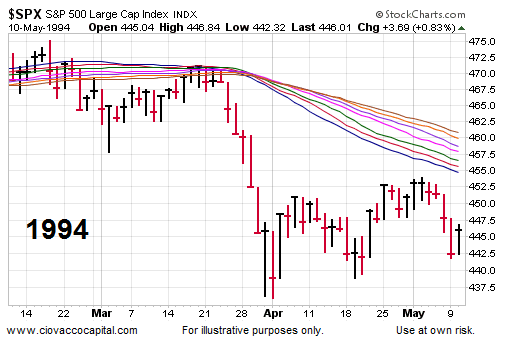
Like many of the charts shown here, the favorable entry point tends to occur when price is relatively close to the moving averages (less or no white space relative to 2015).
1997 – Much Stronger Trends
2015 really looks nothing like the 1997 chart below. Fourteen days after the favorable entry point, price was already back ABOVE the moving averages, telling us the trends in 1997 were much more “sustainable rally” friendly than the 2015 moving averages shown at the top of this article.

1998 – No White Space
Everything we just said about 1997, applies to 1998.

1999 – Bottom Took Time
In 1999, price stayed below the downward-sloping moving averages for several weeks. The moving averages acted as resistance on two occasions. Once the bottoming process was complete, price was able to cross now-flat moving averages. The flat moving averages tell us the battle between the conviction to buy and the conviction to sell is fairly mixed or equal. Contrast the slopes of the flat moving averages below (where price crossed) to the present day moving averages.

2004 – Similar Bottoming Process
Like 1999, the downward-sloping moving averages acted as resistance. When some of the moving averages started to flatten out, stocks were able to form a sustainable bottom.

2005 – Tight MAs Act As Resistance
The risk in the 2005 market, near the favorable risk-reward entry point, was much lower than it is today. How do we know that? Fourteen trading days after the last retest of the lows, price was above all the moving averages (much more favorable trends). Contrast that with price today 14 days after the recent low - price is way below the same moving averages.

2006 - Deja Vu All Over Again
2006 looks very similar to 2005. Notice how the market had two countertrend rallies (both failed) before volatility calmed down and a sustainable bottom was in place. Price was above all the moving averages 14 trading days after the favorable risk-reward entry point.

2010 Is More Difficult
After the flash crash in early May 2010, it took the market several months to find a sustainable low. The sharp rally that had quite a bit of “give back” occurred when the slopes of the moving averages were still down, telling us the odds of a retest were relatively high. The odds of a second break above the moving averages was higher since the moving averages were flat. It typically, not always, takes time for price and the moving averages to get back in sync, which occurs during what is often a multi-week bottoming process.

2011 May Be The Most Similar To 2015
In 2011 stocks went sideways for several months, then tanked in late July/early August, leaving “a lot of white space” between price and the moving averages. Stocks did not make a fast and easy bottom. The market did not find a low until almost two months later (October 4). By the time the market was ready to rally, price and the moving averages were back on the same page (no white space).

1986 - Rally and A Retest
The odds of a rally were better in 1986 since the slopes of the moving averages were much flatter than what we have today. The market did make a lower intraday low during the retest of the prior low.

How Can All This Help Us?
Do the charts above help us predict what will happen in 2015? No, they help us assess probabilities of success and risk-vs.-reward. Could the present day market rally strongly from a lower probability set-up and make new highs? Yes, anything is possible in the markets. Regardless of the outcome over the next few weeks/months, there is no question that the evidence we currently have in hand says the market’s risk-reward profile has improved a bit, but remains unquestionably unfavorable.
Three Pictures - Worth A Thousand Words
Would most investors liked to have been given a “this is a poor risk-reward market” warning in late 2007? Would most investors liked to have been given a “hey, the facts are improving” notice before the S&P 500 started a big rally following a big scare in 2011? The answers speak to risk vs. reward. Low probability markets can improve (see 2011 turn below), but we need to see the beginnings of significant improvement before we begin to put more capital in harm’s way. That process of improvement may have already started in 2015, but right now the charts below speak for themselves.

Risk: Price Often Rallies Back To Moving Averages
As the historical charts show, it is not uncommon for price to rally back to downward-sloping moving averages and then fail. Using the daily moving averages in this post, that means a countertrend move to 2040 or 2050 is well within reason, even under the most bearish longer-term scenarios. Last Friday’s video covered the “be open to a countertrend move” scenarios here and here.
Could A Bottom Be In?
Yes, stocks may have already made a bottom and they could rally for weeks, months, or years from their current position. If that is the case, the charts and hard data will begin to show incremental improvement, just as the 2011 chart above did not “miss the turn”. We are open to all outcomes. If the evidence improves, the rules will require that we take action. We may add to our stock holdings before the week is over, but we have not seen enough yet.
Disclosure: This post contains the current opinions of the author but not necessarily those of Ciovacco Capital Management. The opinions are subject to change ...
more

