
Chip Mania – Week In Review
In the span of a few weeks, investor sentiment seems to have shifted from extremely negative to positive. To top it off this week, Congress passed the $280 billion Chips and Science (CHIPS+) Act creating chip mania. Importantly, this Act builds on the $1.2 trillion Infrastructure Act passed at the end of 2021.

We call it chip mania because it provides grants, subsidies, incentives, and tax breaks to US semiconductor manufacturers. It promotes the building of semiconductor plants in the US. States like California, Arizona, Texas, Ohio, and New York should benefit based on announced plans for semiconductor fabs. Furthermore, the CHIPS+ Act provides money for artificial intelligence (AI), robotics, quantum computing, and more. Chip mania indeed.
Stock Market Overview
Chip mania is about the future. But the markets bounced back from their lows a few weeks ago when we highlighted that Stocks Were Undervalued. Some investors call it a bear market rally, but others say it’s the start of a new bull market. I believe the latter is true. Many stocks are off their lows, and some have recovered substantially. For example, T. Rowe Price (TROW) hit a 52-week low of $104.75 and is now trading at $123.47. The stock was highlighted several times by Dividend Power’s authors.
The chart below from Stock Rover* shows the past month’s index, asset class, and sector performance. Sectors that were down are now leading the pack. Risk is seemingly back in vogue.

Source: Stock Rover*
Why Is the Market Rallying?
Despite recession fears, persistent supply chain issues because of COVID-related shutdowns in China, and the US Federal Reserve increasing the Federal Funds rate but another 0.75%, the market is rallying. Why is the market rallying? Certainly, chip mania is not enough. There are four reasons: gas prices are down significantly, food prices are down, mortgage rates are declining, and unemployment is still low with robust job growth.
Gas Prices Are Down
After peaking at over $5 per gallon in much of the country in mid-June, gas prices are down. The AAA national average is $4.232 per gallon. Demand is lower than last year, and inventories are building again. As a result, people are likely to drive less.
Food Prices Are Down
Food prices are starting to decline in the US and globally. For example, wheat futures are down after spiking because of the Ukraine War. If grain shipments resume, prices will probably drop further. Poor results from Walmart (WMT), the nation’s largest grocer, suggest future discounting. Stores have too much stuff based on pandemic spending habits, and consumers are reverting to old patterns.
Mortgage Rates Are Down
After peaking at nearly 6%, the 30-year fixed mortgage rate is down to about 5.3%. In addition, the 15-year fixed and 5-year adjustable mortgage rates are also down from their recent high. This change means buyers can better afford homes.

Source: Freddie Mac
Unemployment Is Low
Unemployment is low, and job growth is robust. The unemployment rate is at 3.6%, hardly a value indicating a recession. The US had four straight months of nearly 400,000 jobs created. The private sector now has more jobs than before the pandemic, while the number is still lower. Recessions typically include slowing job growth and rising unemployment, but the opposite seems to be occurring now. However, that said, the US has had two consecutive quarters of declining GDP because of lower investment and inventories.
Final Thoughts on Chip Mania
The CHIPS+ Act is a plus for the economy and will create a frenzy for grants and subsidies. The chip mania will be interesting to watch and should drive investment and job growth.
Furthermore, the stock market is rallying and coming off its lows. Bad news has moderated, and arguably investors are more optimistic. Those who took advantage of undervalued stocks probably got excellent value. As Peter Lynch has indicated, the average investor has some advantages and can perform well following a disciplined strategy.
The Stock of the Week
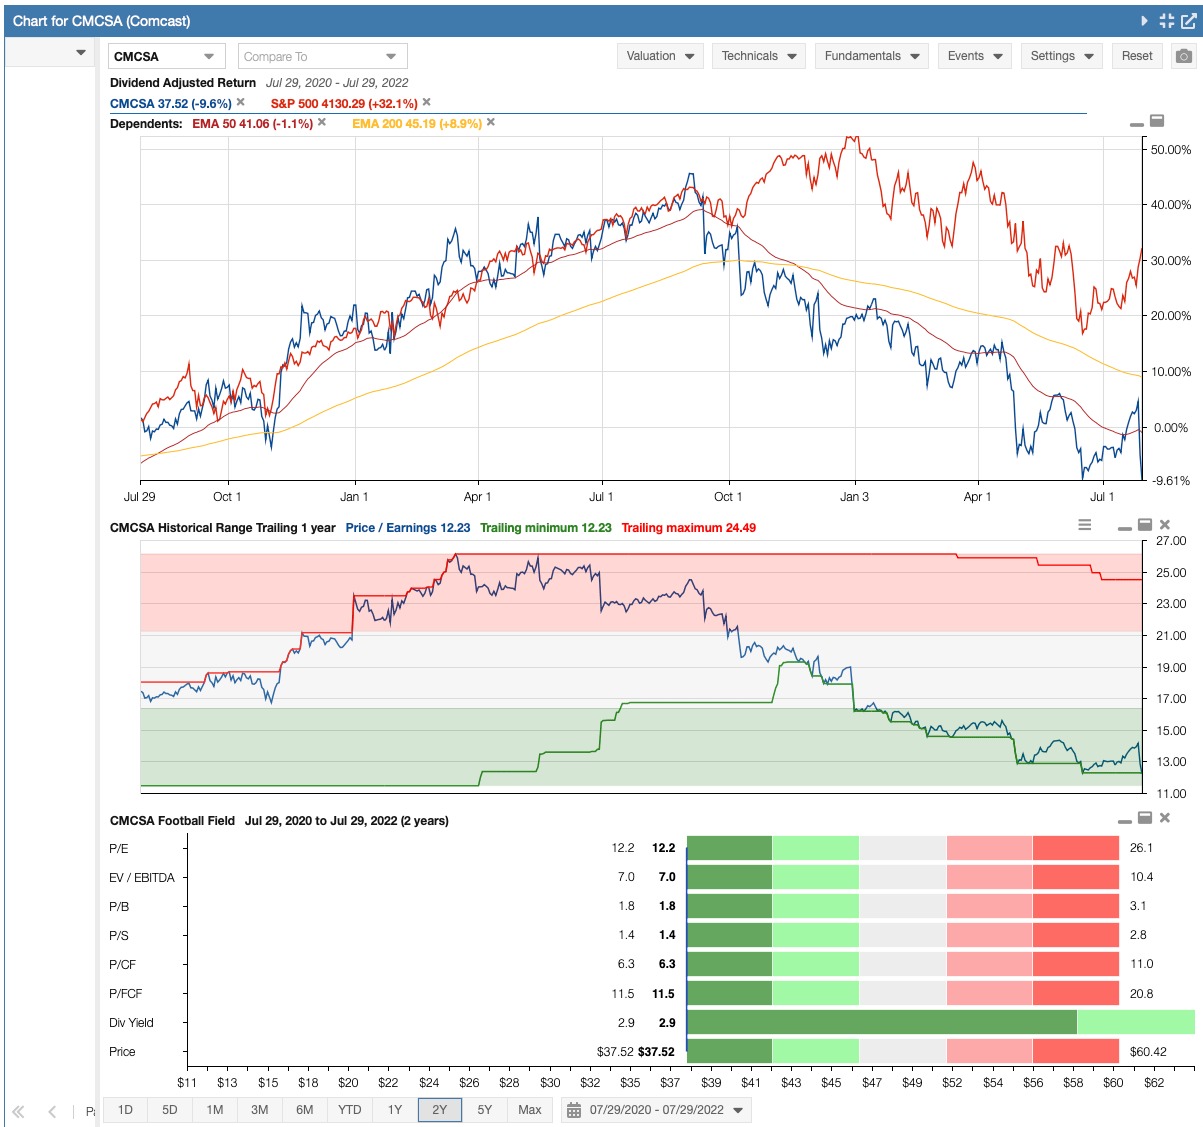
Today we highlight Comcast Corporation (CMCSA), the cable, phone, and content giant. According to Stock Rover*, the stock price was down about 24% in 2022 and 343% in the past 1-year. Comcast’s stock price is down because of worries over subscriber growth.
The dividend yield is around 2.8%, the highest in the past decade and more than the 5-year average of about 2%. In addition, Comcast is a Dividend Contender and, according to Dividend Radar, has 14 years of dividend increases. Comcast should do well as a consolidator in the industry. The forward P/E ratio is about 10.4X, below the 5-year range and at the lower end of the 10-year range.
Source: Stock Rover*
Dividend Increases and Reinstatements
Search for a stock in the list of dividend increases and reinstatements. This list is updated weekly. In addition, you can search for your stocks by company name, ticker, and date.
Dividend Cuts and Suspensions List
The dividend cuts and suspensions list was most recently updated at the end of July 2022. As a result, the number of companies on the list has risen to 563. Thus, well over 10% of companies that pay dividends have cut or suspended them since the start of the COVID-19 pandemic. The list is updated monthly.
Three new additions indicate companies are experiencing solid profits and cash flow in July.
The new additions were Rio Tinto (RIO), Industrial Logistics Properties (ILPT), and Franklin Street Properties (FSP).
Market Indices
07/30/22
Dow Jones Industrial Averages (DJIA): 32,846 (+2.97%)
NASDAQ: 12,391 (+4.70%)
S&P 500: 4,1309 (+4.26%)
Market Valuation
The S&P 500 is trading at a price-to-earnings ratio of 20.87X, and the Schiller P/E Ratio is about 30.99X. These multiples are based on trailing twelve months (TTM) earnings.
Note that the long-term means of these two ratios are approximately 16X and 17X, respectively.
The market is still overvalued despite the recent market correction and a bear market. Earnings multiples more than 30X are overvalued based on historical data.
S&P 500 PE Ratio History

Source: multpl.com
Shiller PE Ratio History

Source: multpl.com
Stock Market Volatility – CBOE VIX
This past week, the CBOE VIX measuring volatility was down about 1.7 points to 21.33. The long-term average is approximately 19 to 20. The CBOE VIX measures the stock market’s expectation of volatility based on S&P 500 Index options. It is commonly referred to as the fear index (VIX).

Source: Google
Yield Curve
The two yield curves shown here are the 10-year US Treasury Bond minus the 3-month US Treasury Bill from the NY York Fed and the 10-year US Treasury Bond minus the 2-year US Treasury Bond from the St. Louis Fed.
Inversion of the yield curve has been increasingly viewed as a leading indicator of recessions about two to six quarters ahead, according to the NY Fed. The higher the spread between the two interest rates, the higher the probability of a recession (SPTL).

Source: NY Fed

Source: St. Louis Fed
Economic News
The Conference Board’s Consumer Confidence Index declined in July to 95.7, down 2.7 points from 98.4 in June. “Consumer confidence fell for a third consecutive month in July,” said Lynn Franco, Senior Director of Economic Indicators at The Conference Board. “The decrease was driven primarily by a decline in the Present Situation Index—a sign growth has slowed at the start of Q3. On the other hand, the Expectations Index held relatively steady but remained well below a reading of 80, suggesting recession risks persist. In addition, concerns about inflation—rising gas and food prices, in particular—continued to weigh on consumers.” Based on consumers’ six-month outlook for income, business, and labor market conditions, the expectations index ticked down to 65.3 in July from 65.8 the previous month.
The US Census Bureau reported that new orders for manufactured durable goods increased 1.9% to a seasonally adjusted $272.6 billion in June. The increase followed a 0.8% increase in May. Transportation equipment was a primary contributor to the rise, up 5.1% to 92.7. In addition, new orders for manufactured durable goods grew 11.1% yearly.
The first estimate of GDP for 2022 Q2 reported a 0.9% decrease and follows a 1.6% 2022 Q1 decrease. Reduced private inventory investment, residential fixed investment, federal government spending, state, and local government spending, and nonresidential fixed investment contributed to the decline. Inventories that helped boost GDP in 2021 significantly reduced the GDP by two percentage points. A decrease in retail trade, primarily across general merchandise stores and motor vehicle dealers, pulled down inventory investment. Residential investment dropped 14%. Government spending across state, federal, and local governments declined by 1.9%. Business investment fell 0.1% due to decreases in structures and equipment spending. Partially offsetting the Q2 decrease were increases in exports (+18.0) and personal consumption expenditures (PCE).
More By This Author:
Exxon Mobil Shareholders Are Finally Being Rewarded
T. Rowe Price: Attractive Valuation And 4%+ Dividend Yield
The S&P 500: Like A Yo-Yo
Disclaimer: Dividend Power is not a licensed or registered investment adviser or broker/dealer. We are not providing you with individual investment advice on this site. Please consult with ...
more

