
"Index points to little change in economic growth in December." This is the headline for this morning's release of the Chicago Fed's National Activity Index, and here is the opening paragraph from the report:
The Chicago Fed National Activity Index (CFNAI) edged up to –0.49 in December from –0.51 in November. Three of the four broad categories of indicators used to construct the index made negative contributions in December, but two categories improved from November. The index’s three-month moving average, CFNAI-MA3, decreased to –0.33 in December from –0.14 in November. [more]
Background on the CFNAI
The Chicago Fed's National Activity Index (CFNAI) is a monthly indicator designed to gauge overall economic activity and related inflationary pressure. It is a composite of 85 monthly indicators as explained in this background PDF file on the Chicago Fed's website. The index is constructed so a zero value for the index indicates that the national economy is expanding at its historical trend rate of growth. Negative values indicate below-average growth, and positive values indicate above-average growth.
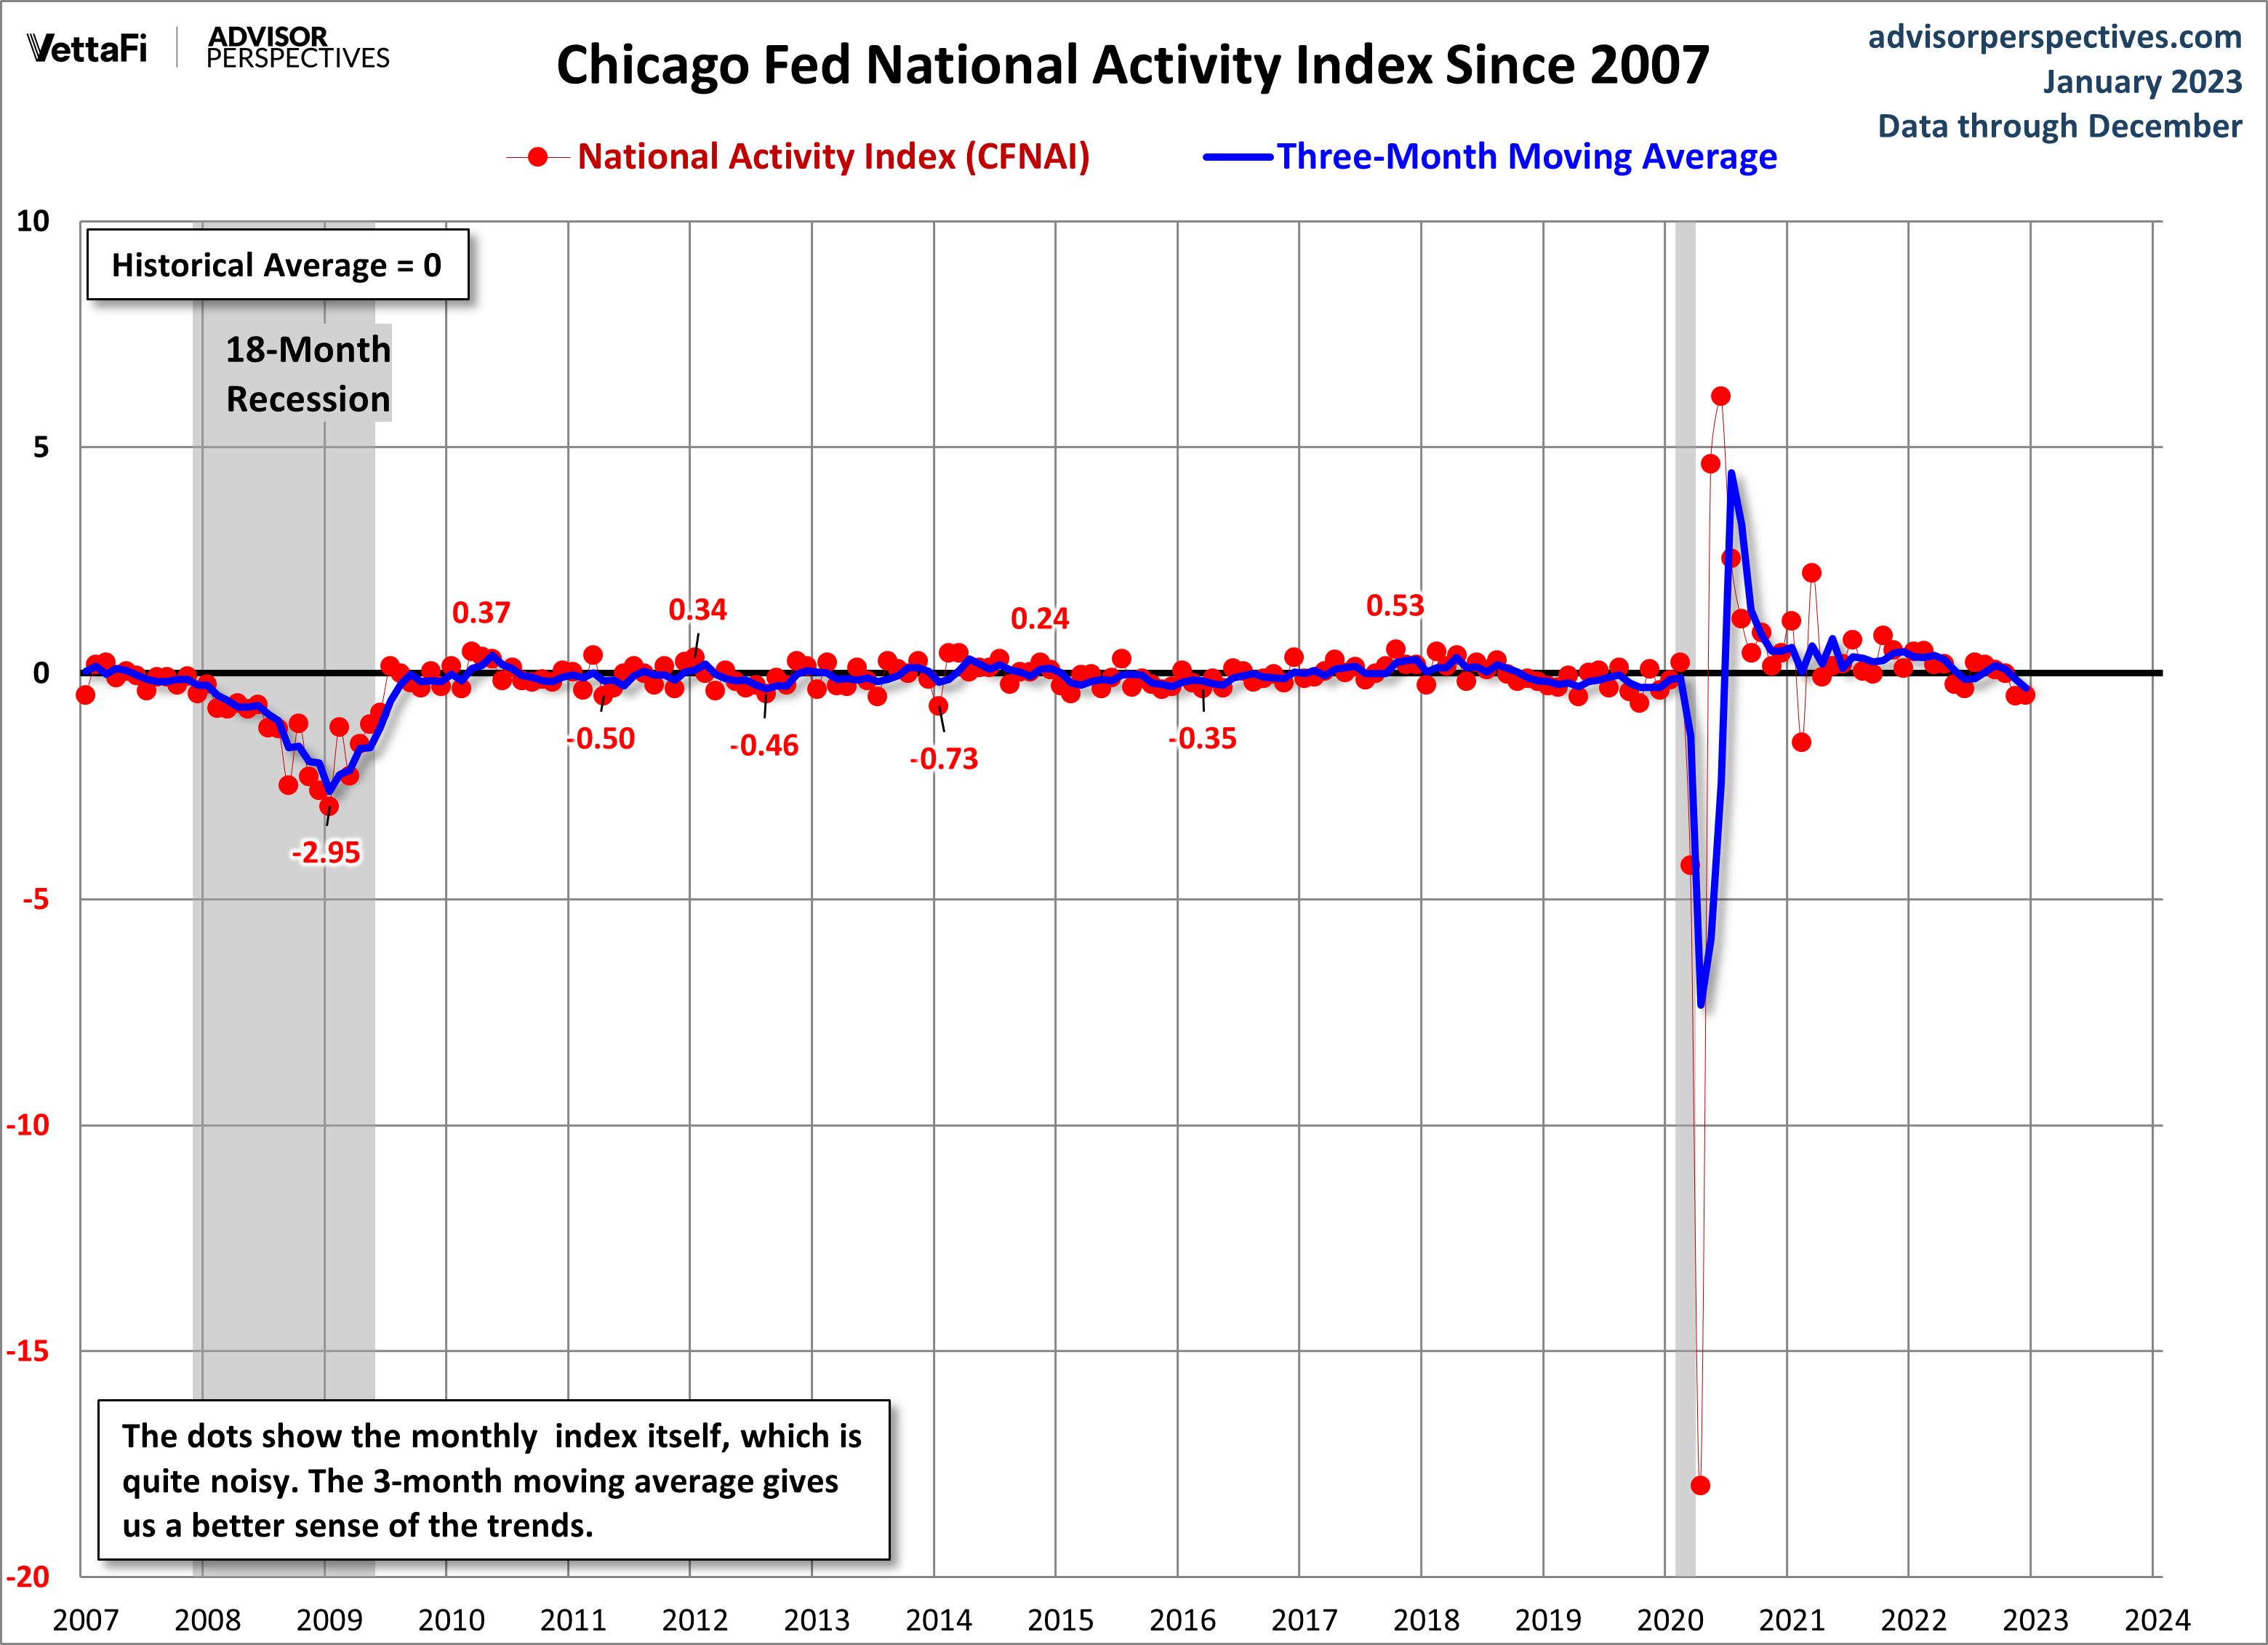
The first chart below shows the recent behavior of the index since 2007. The red dots show the indicator itself, which is quite noisy, together with the three-month moving average (CFNAI-MA3), which is more useful as an indicator of the actual trend for coincident economic activity.
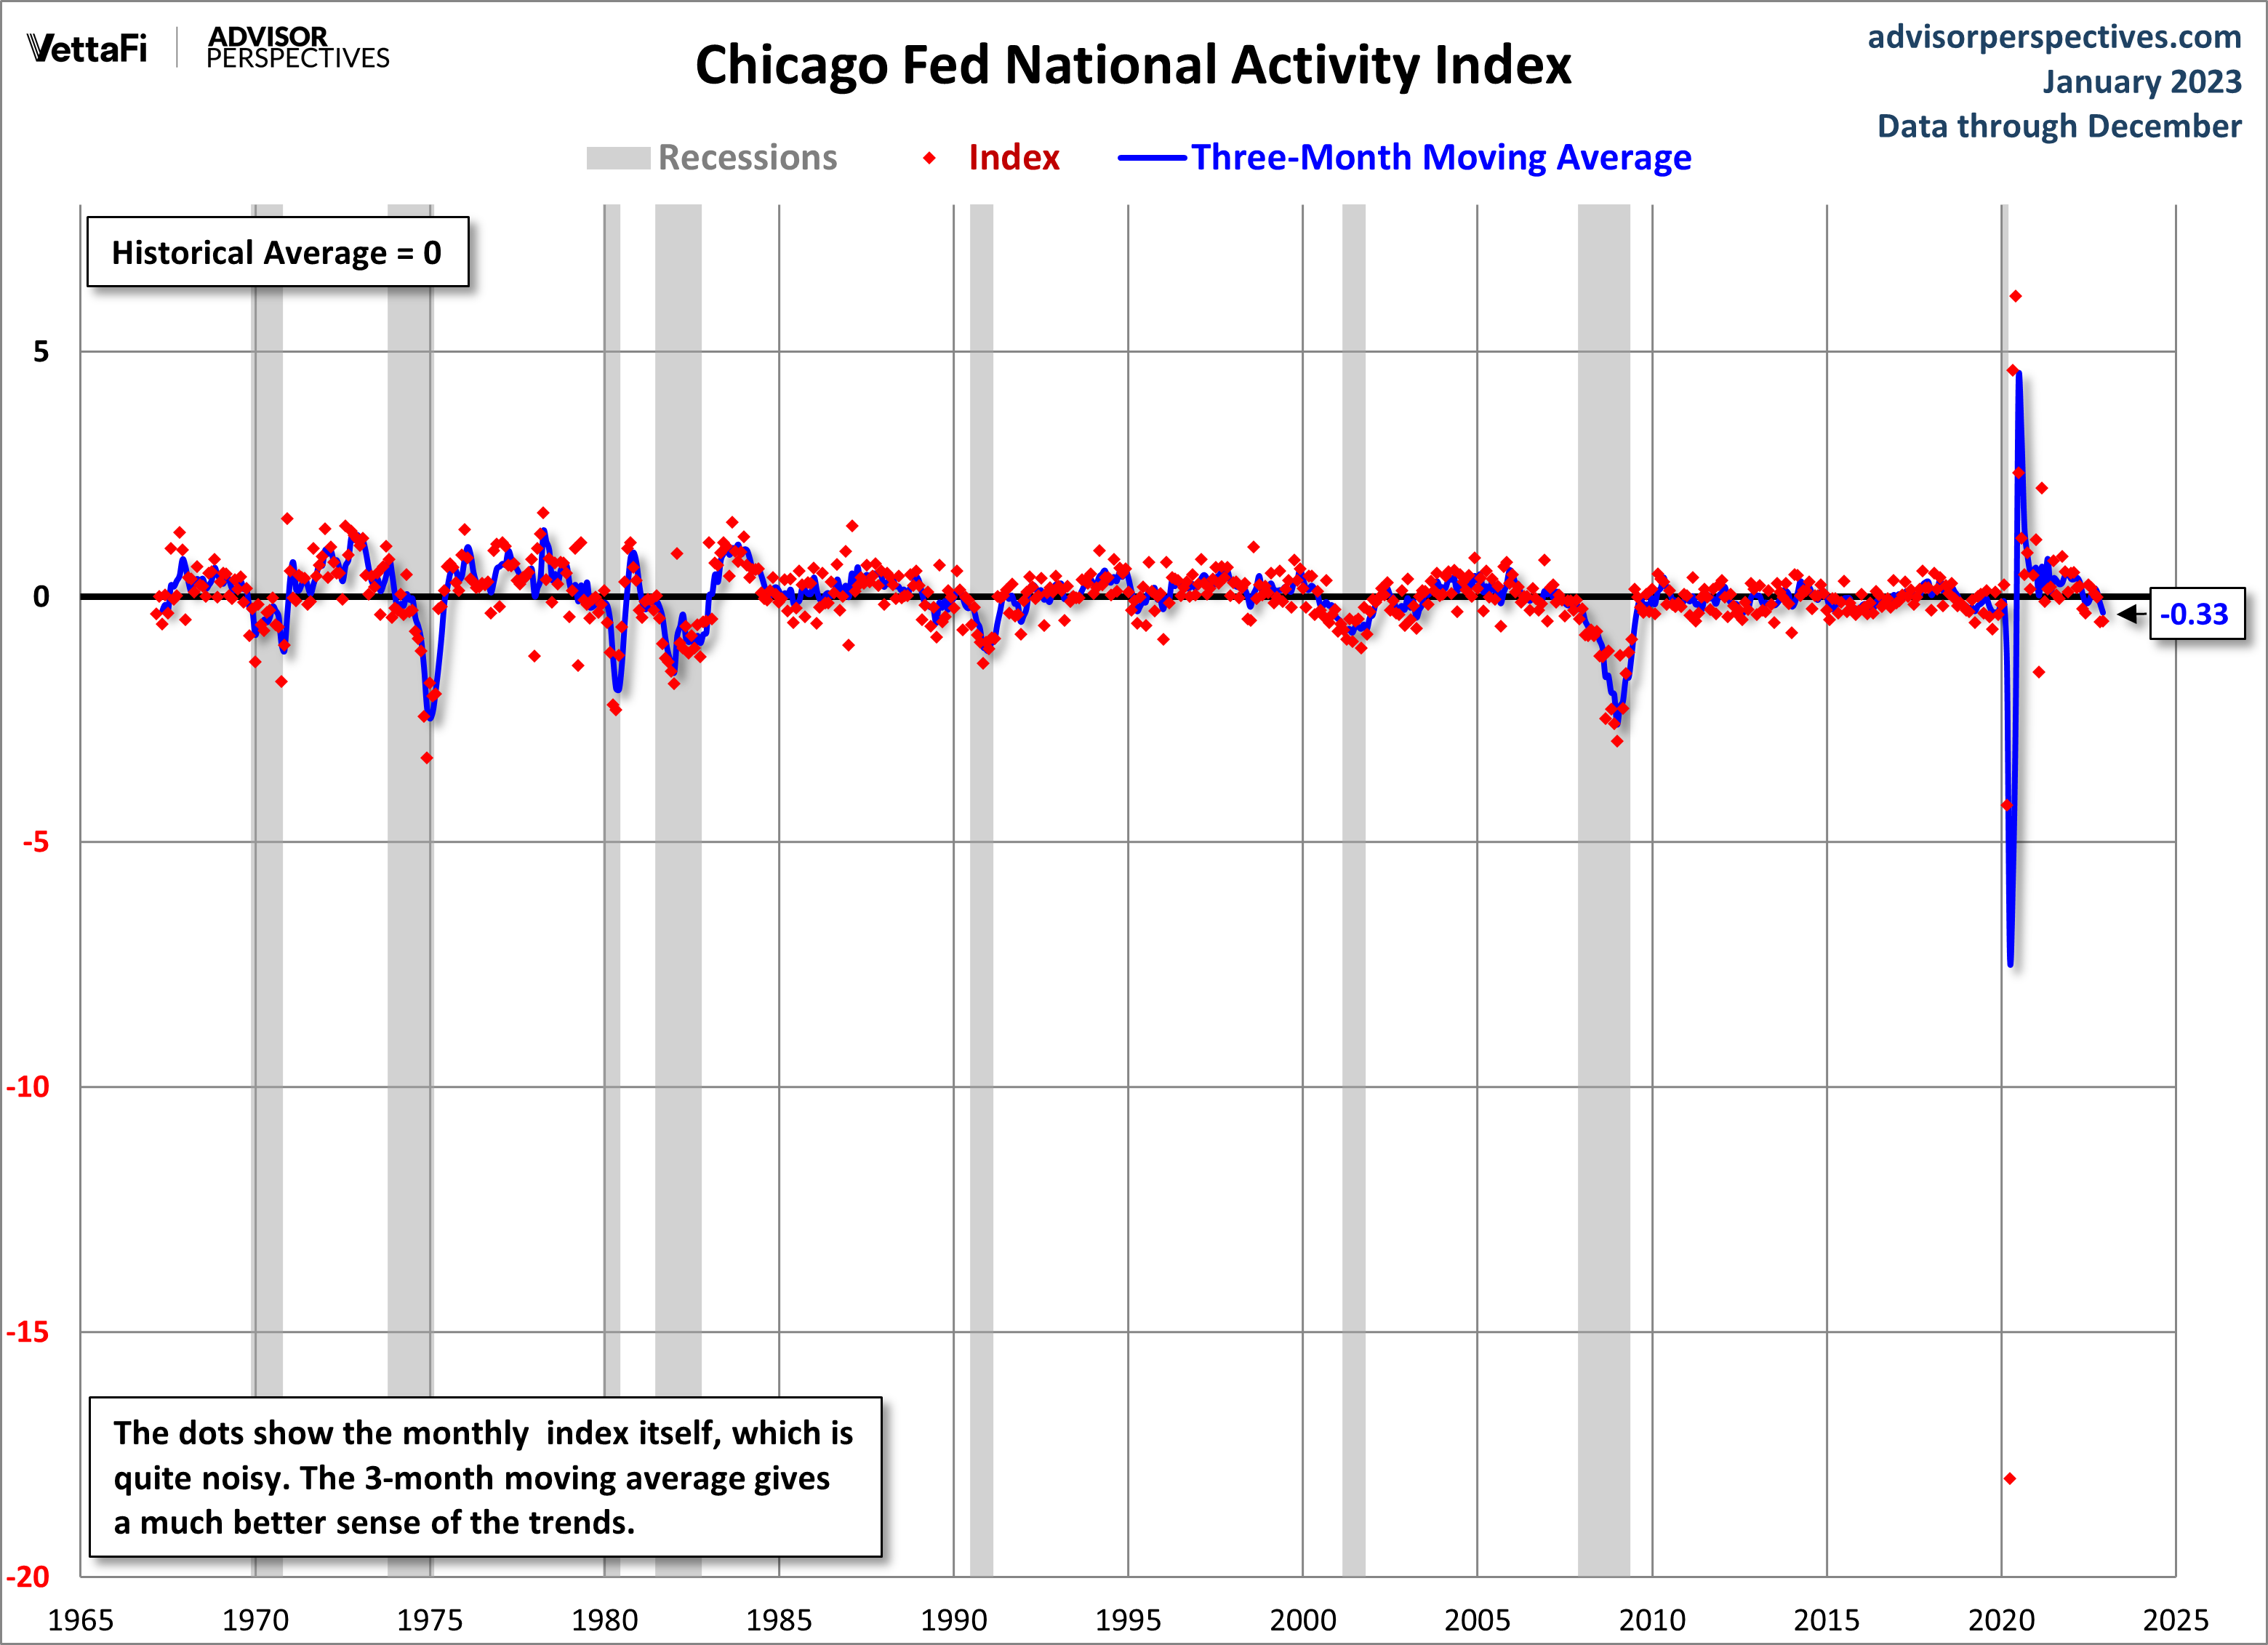
For a broad historical context, here is the complete CFNAI historical series dating from March 1967.
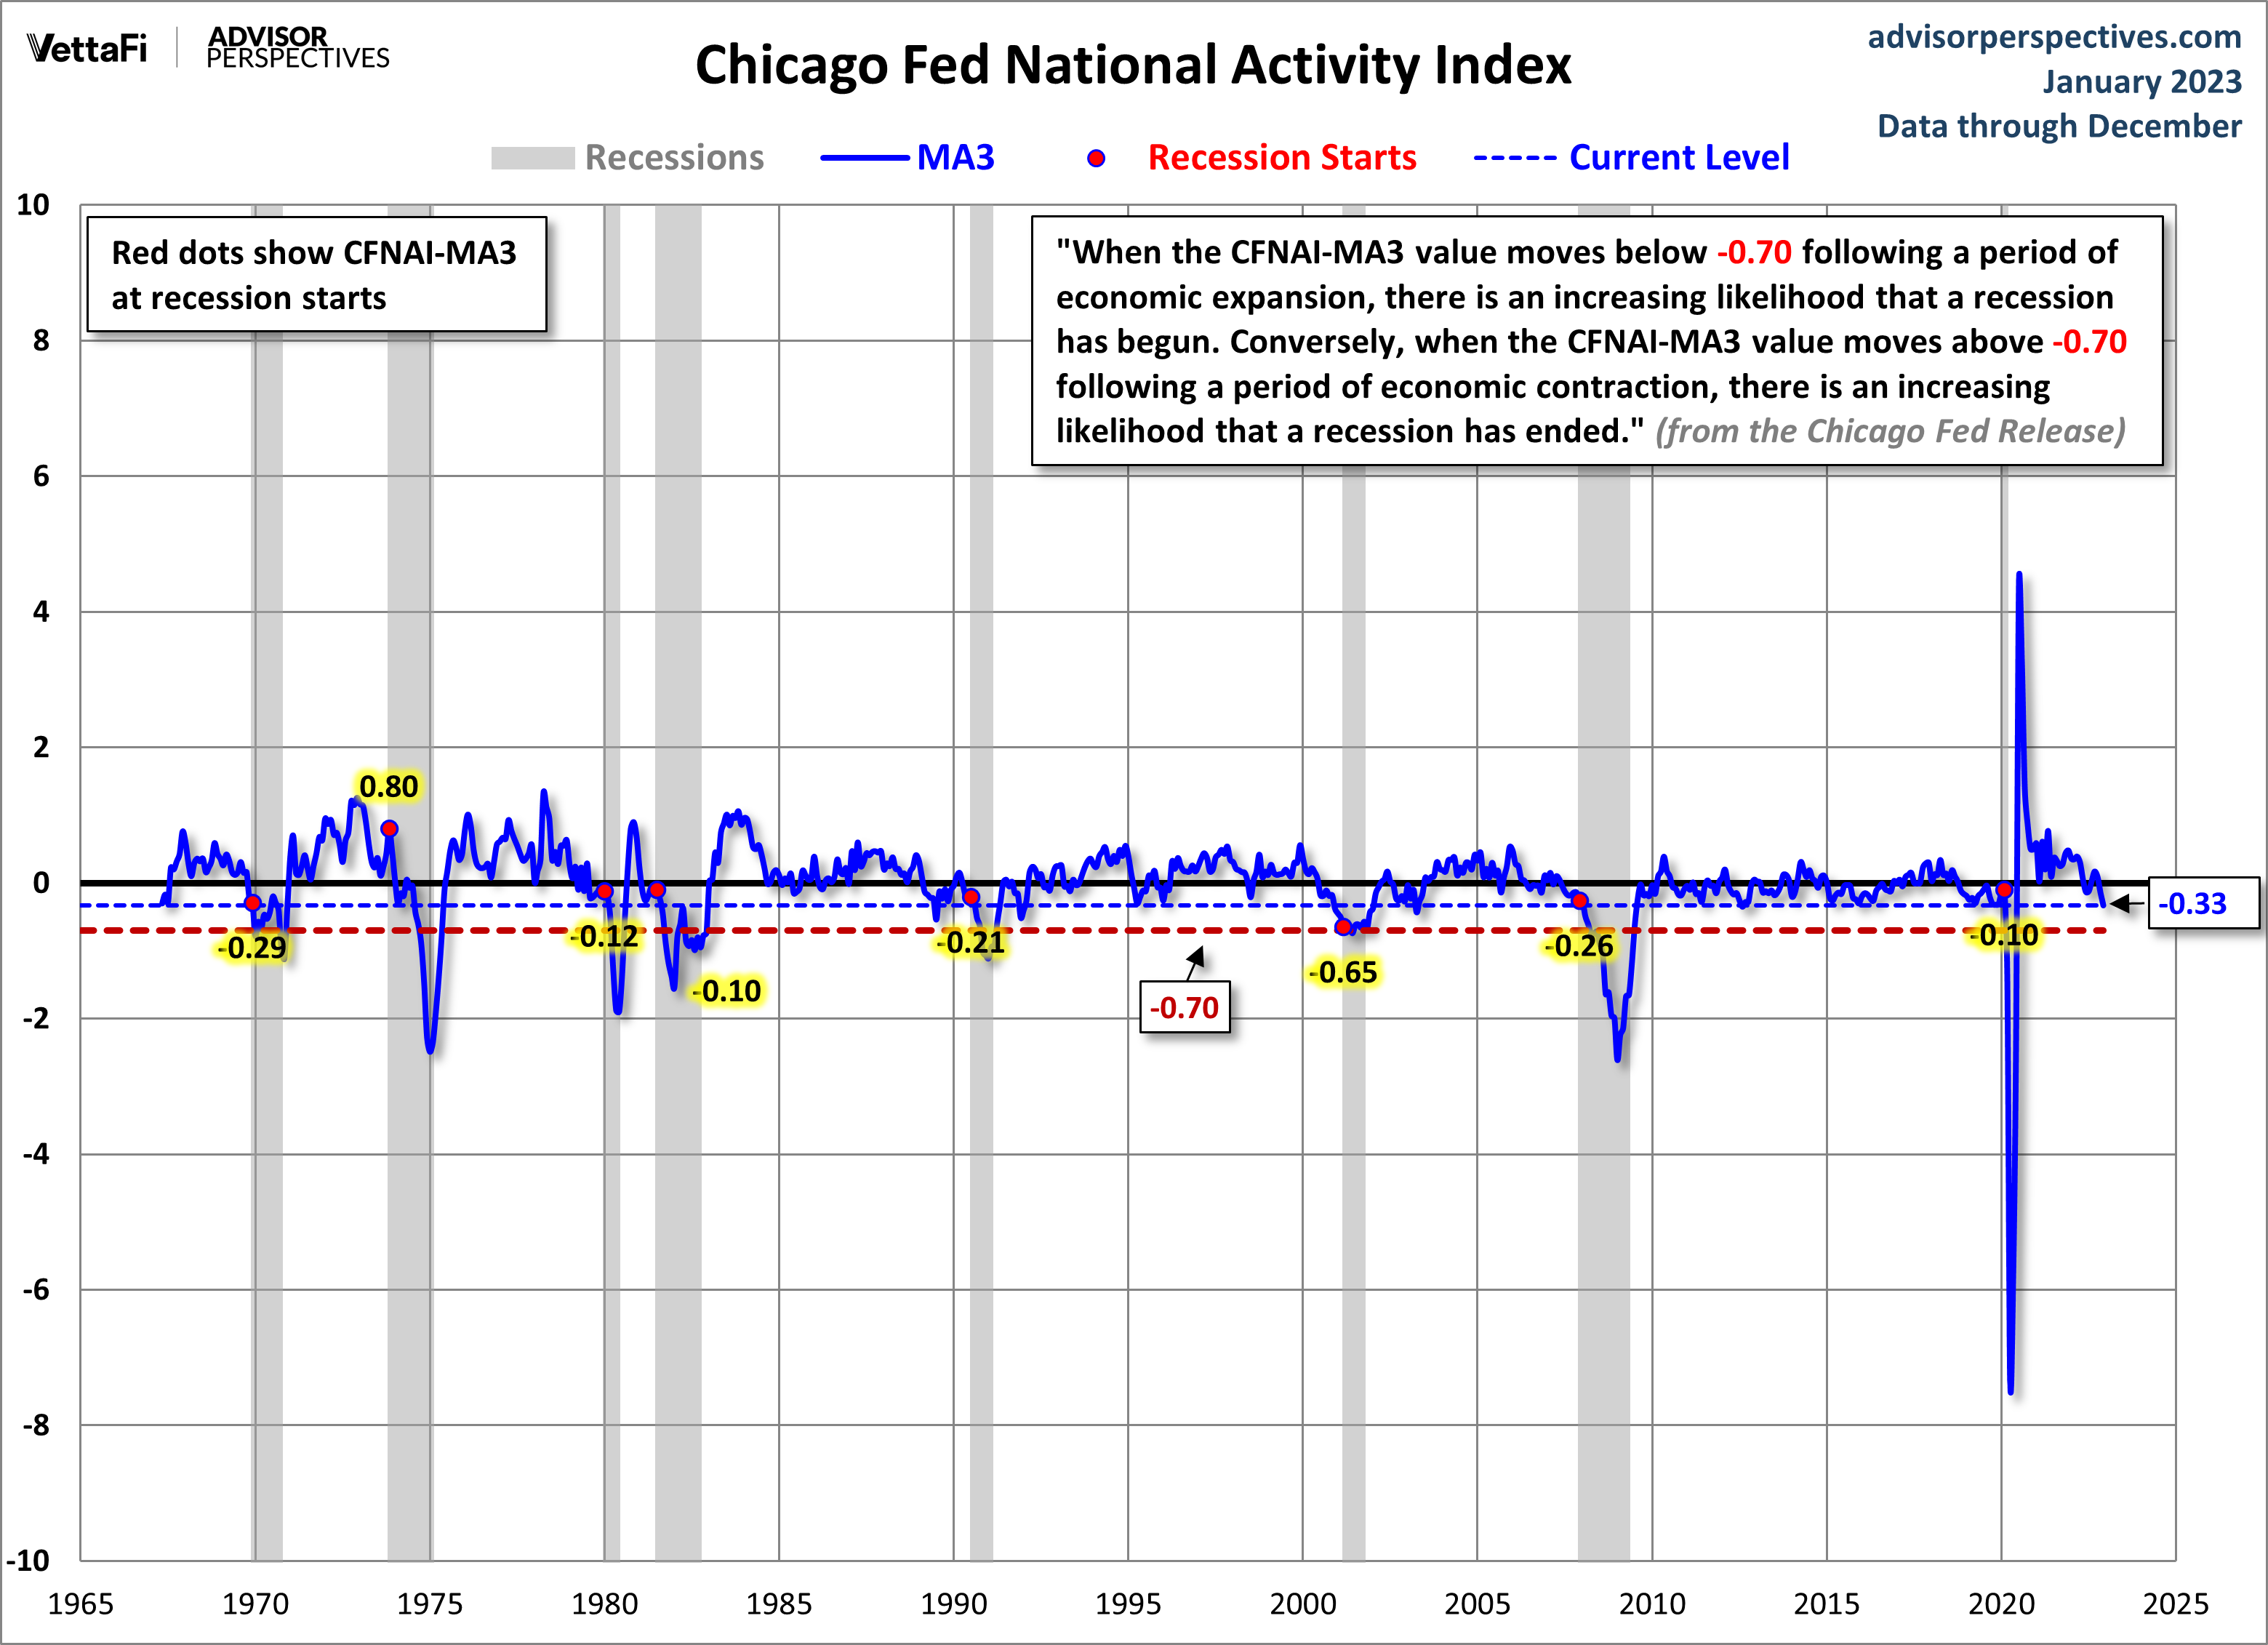
The next chart highlights the -0.7 level. The Chicago Fed explains:
When the CFNAI-MA3 value moves below -0.70 following a period of economic expansion, there is an increasing likelihood that a recession has begun. Conversely, when the CFNAI-MA3 value moves above -0.70 following a period of economic contraction, there is an increasing likelihood that a recession has ended.
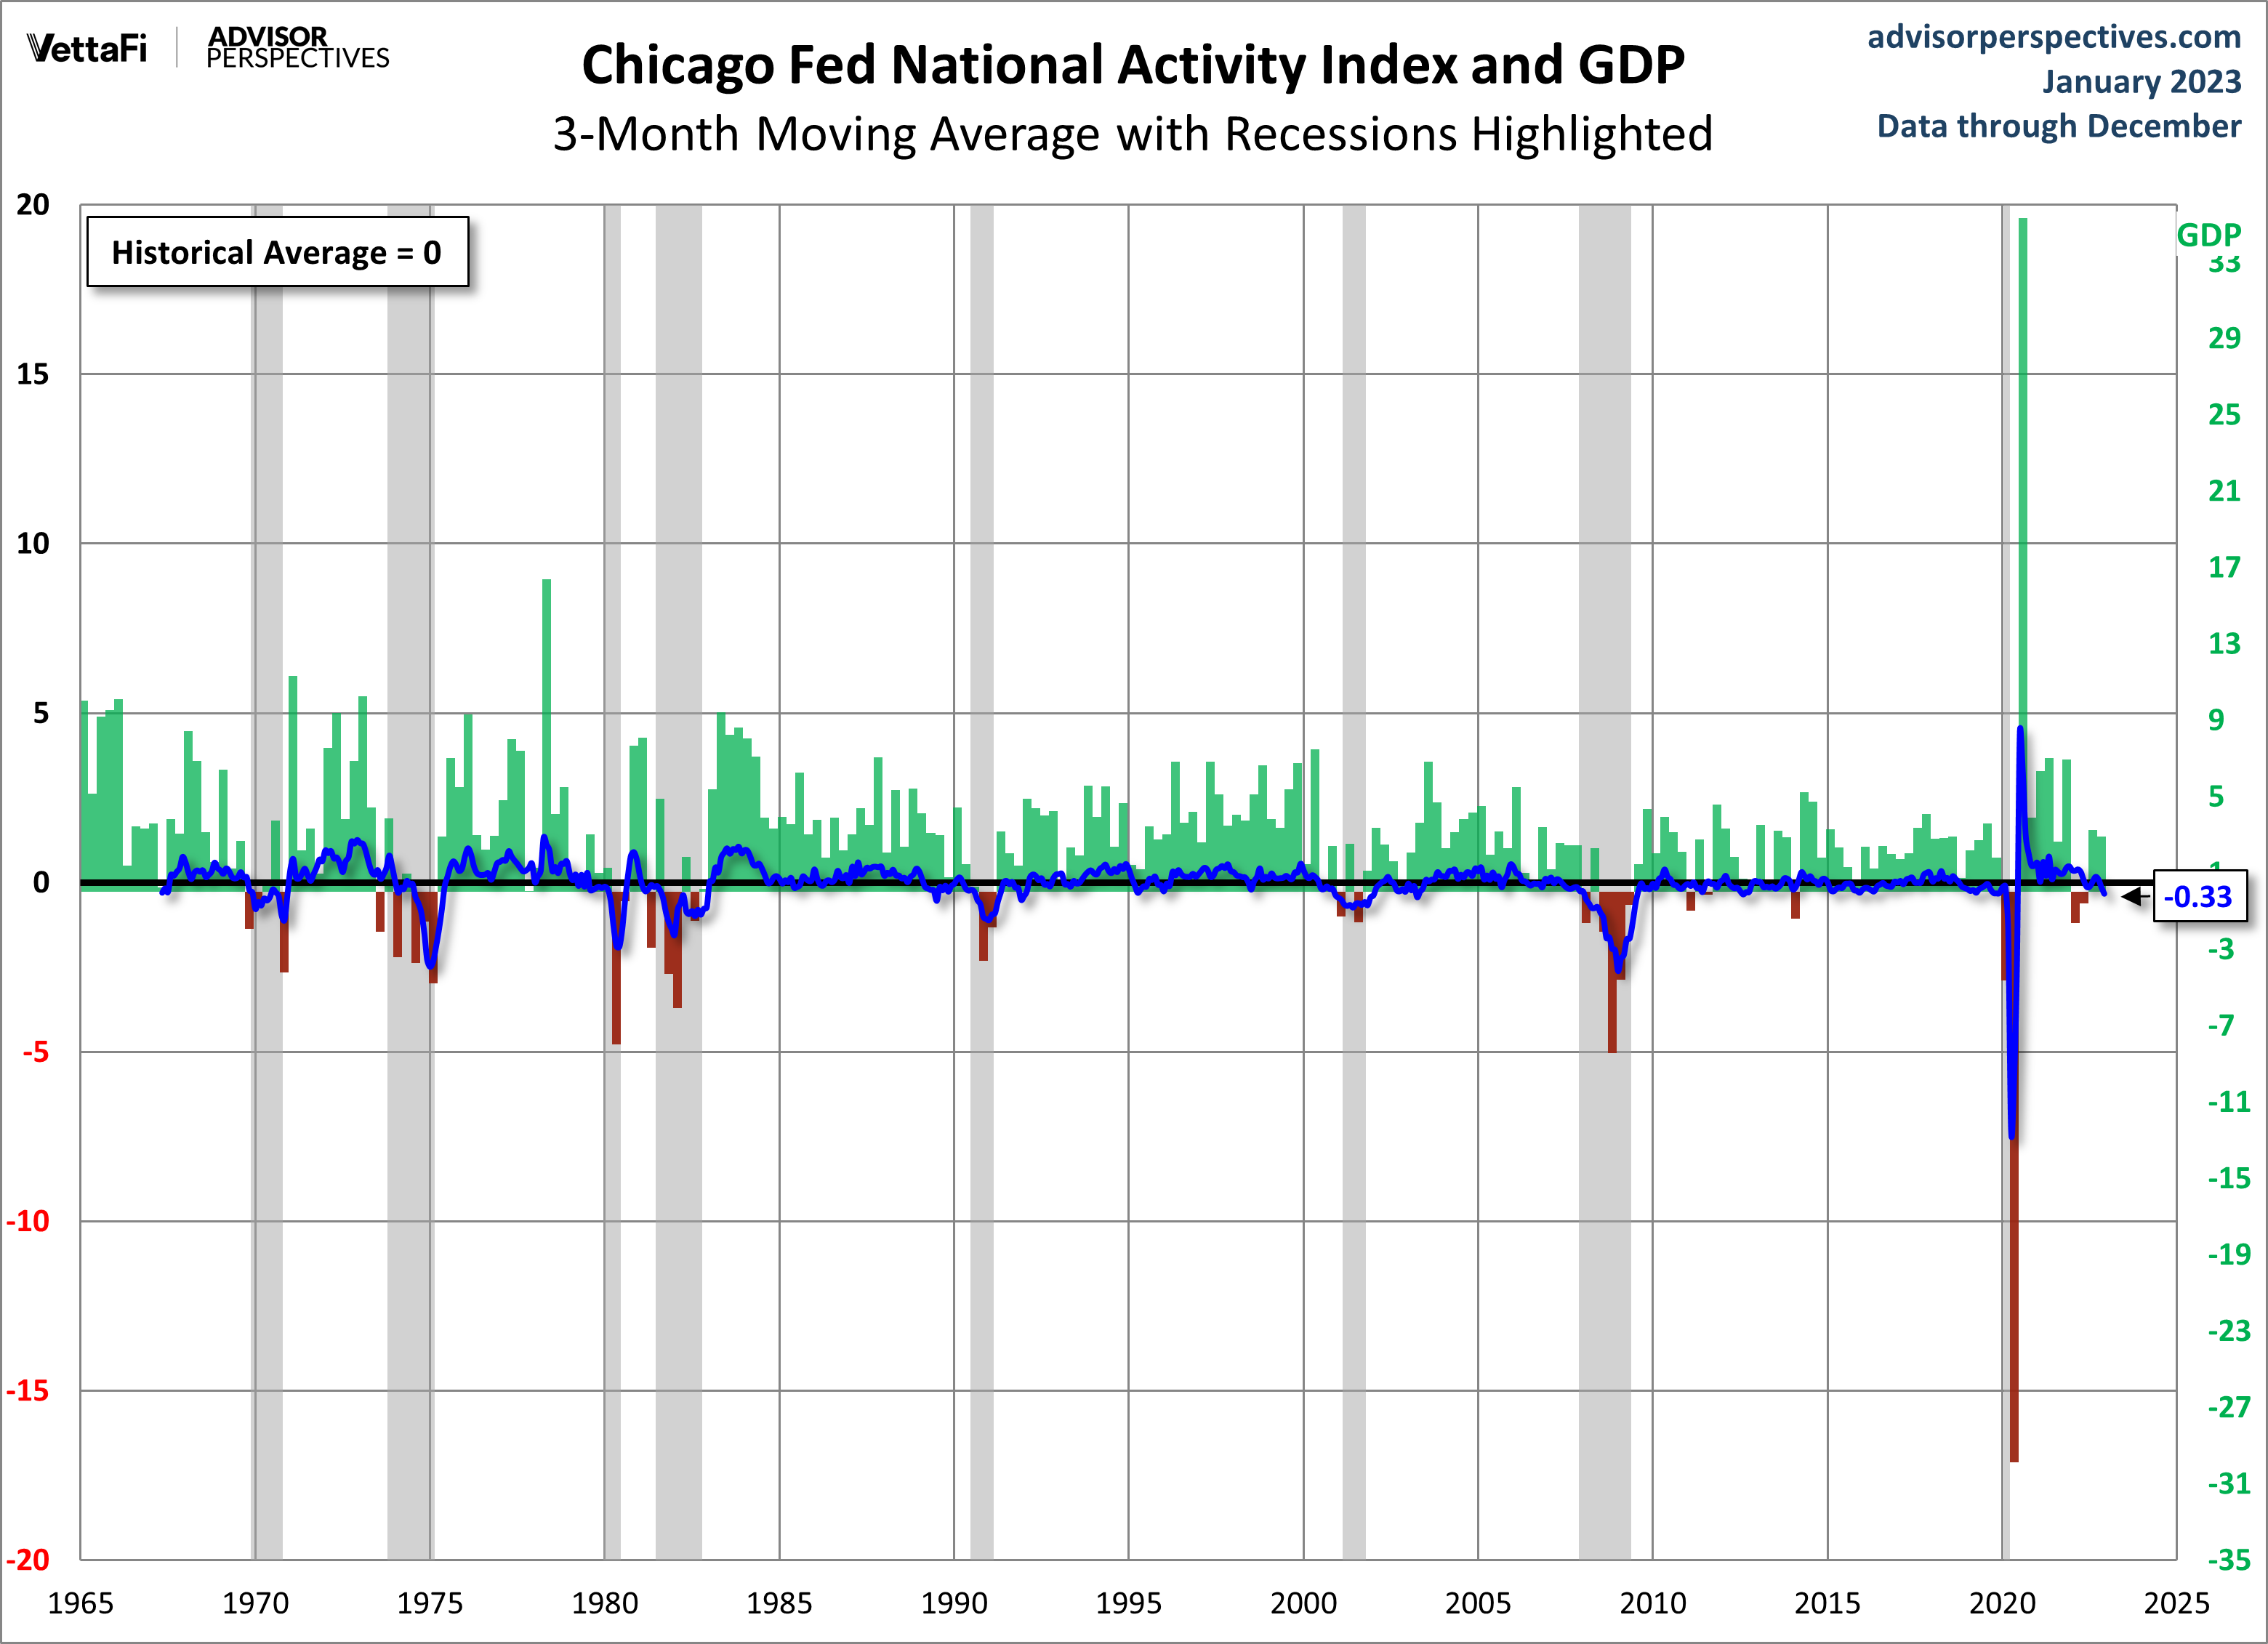
The next chart includes an overlay of GDP, which reinforces the accuracy of the CFNAI as an indicator of coincident economic activity.
Here's a chart of the CFNAI without the MA3 overlay — for the purpose of highlighting the high inter-month volatility.
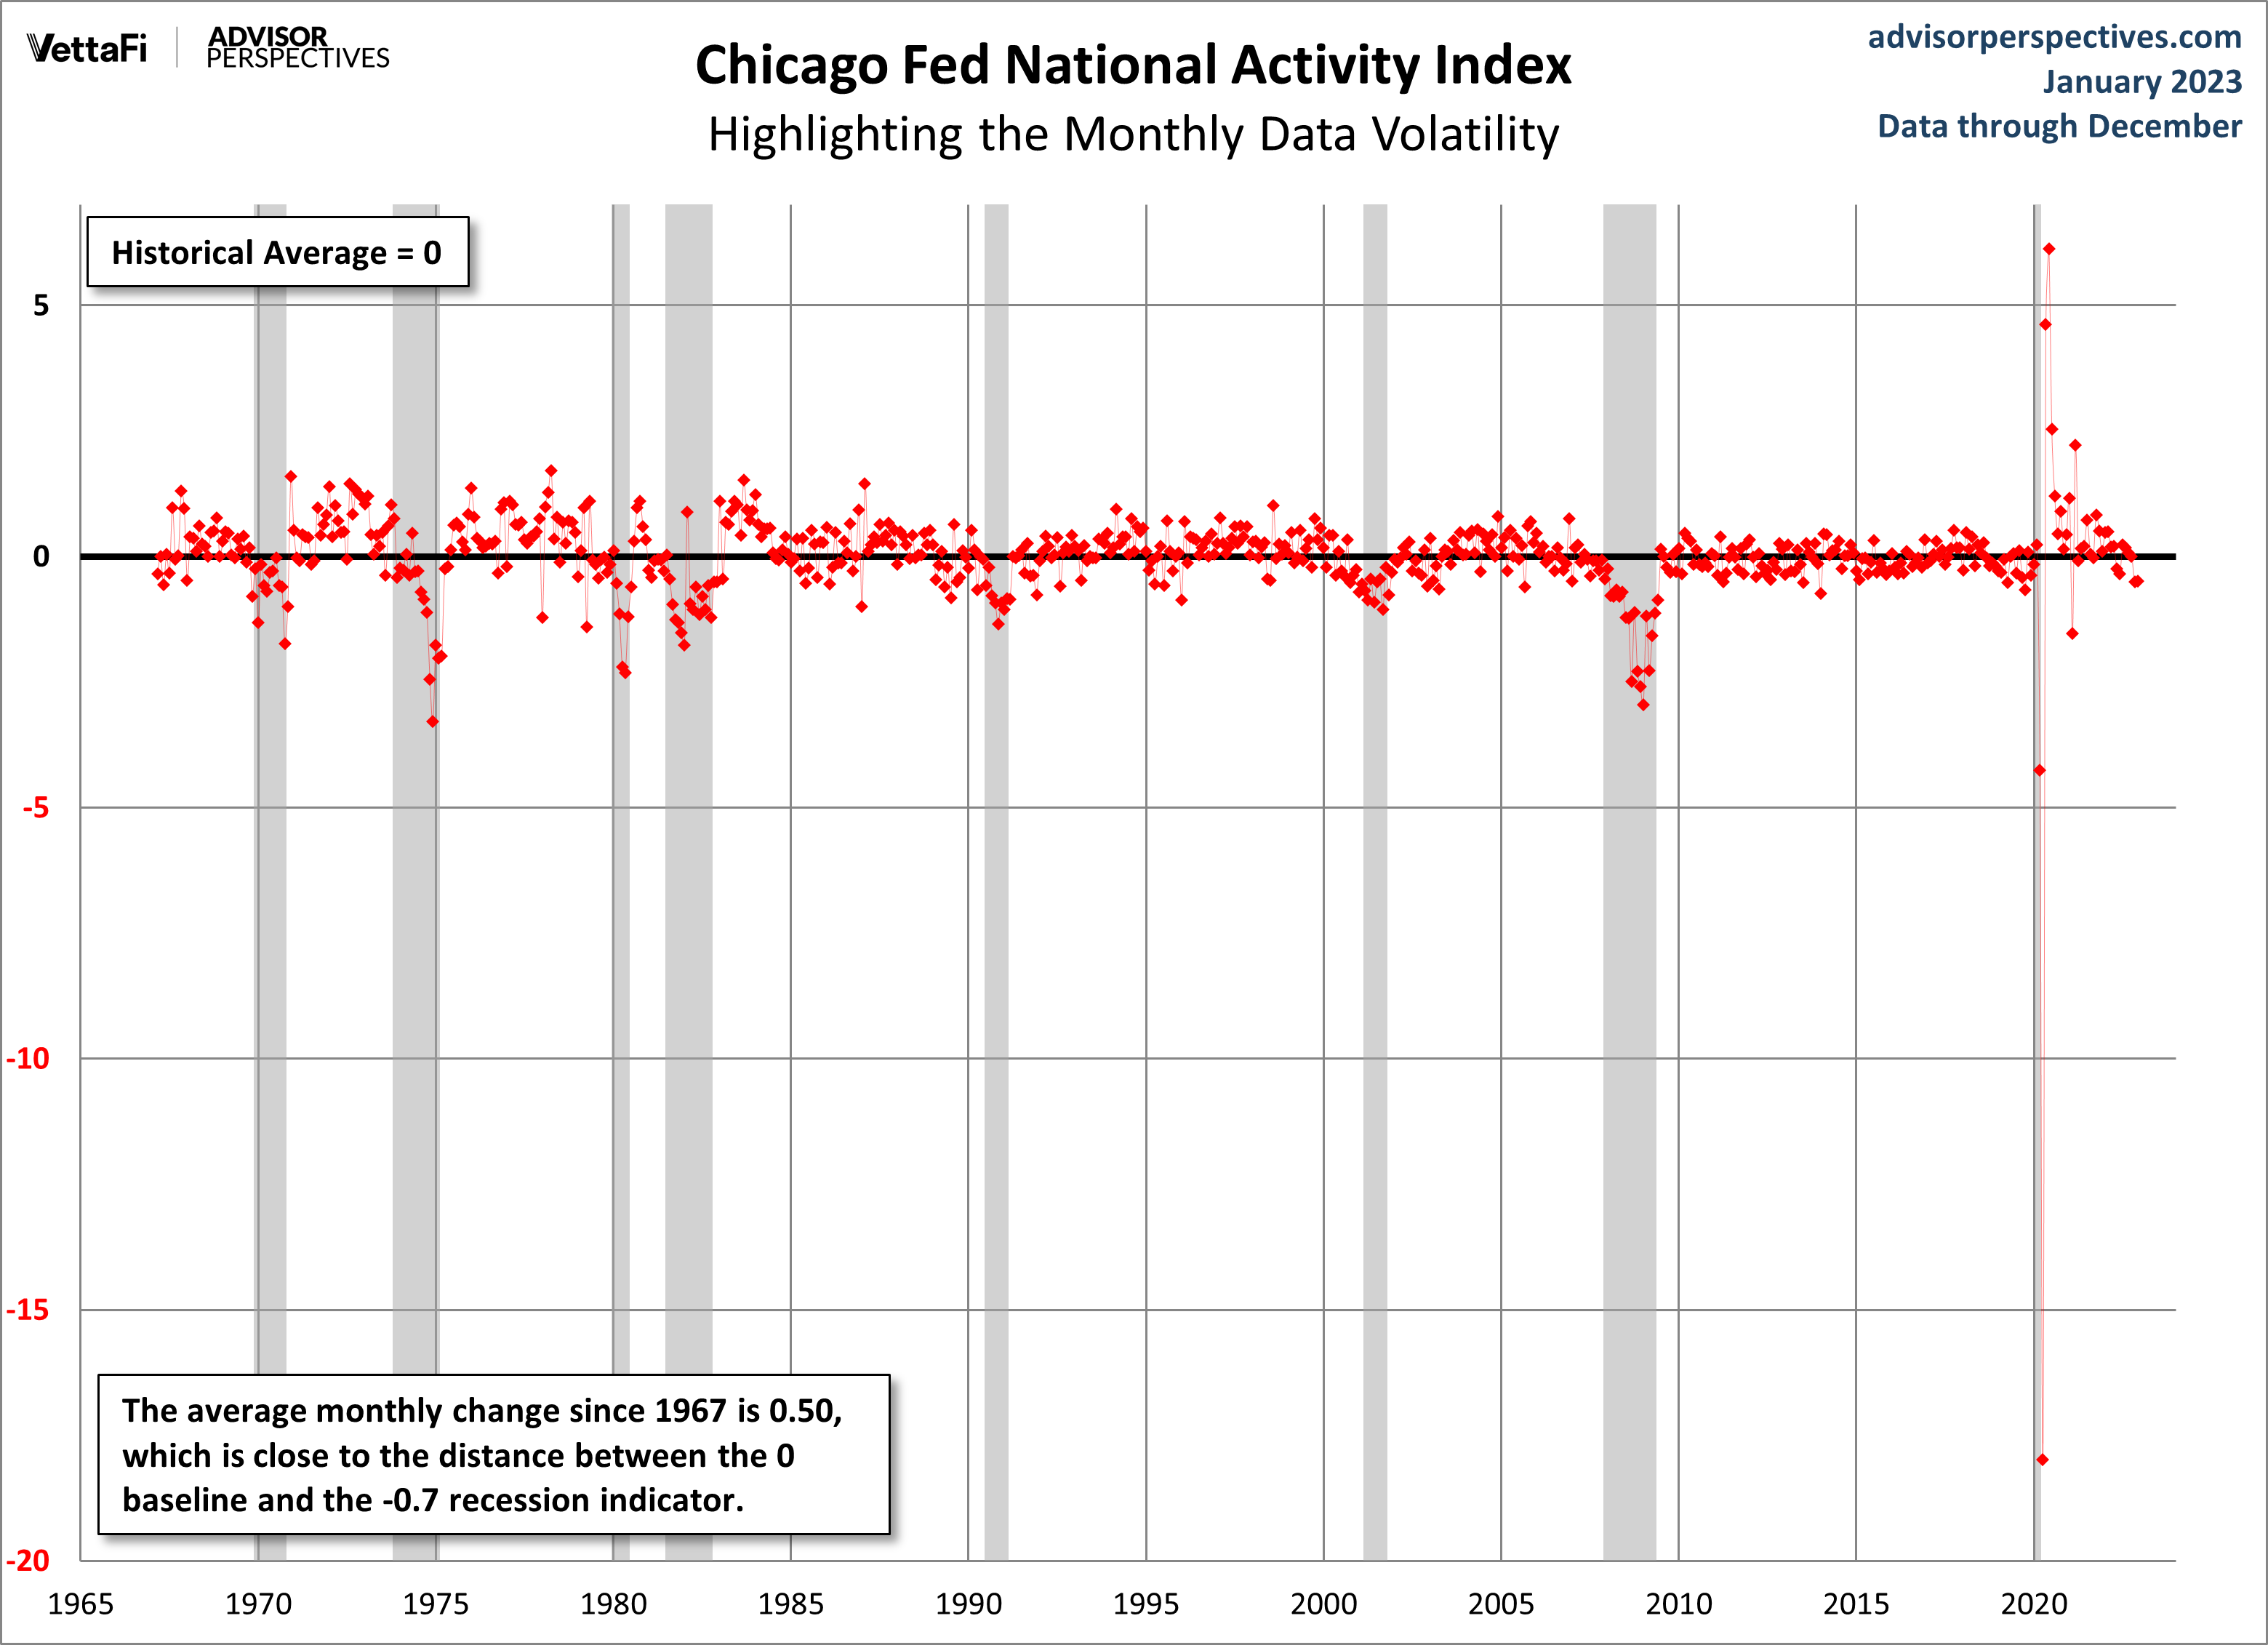
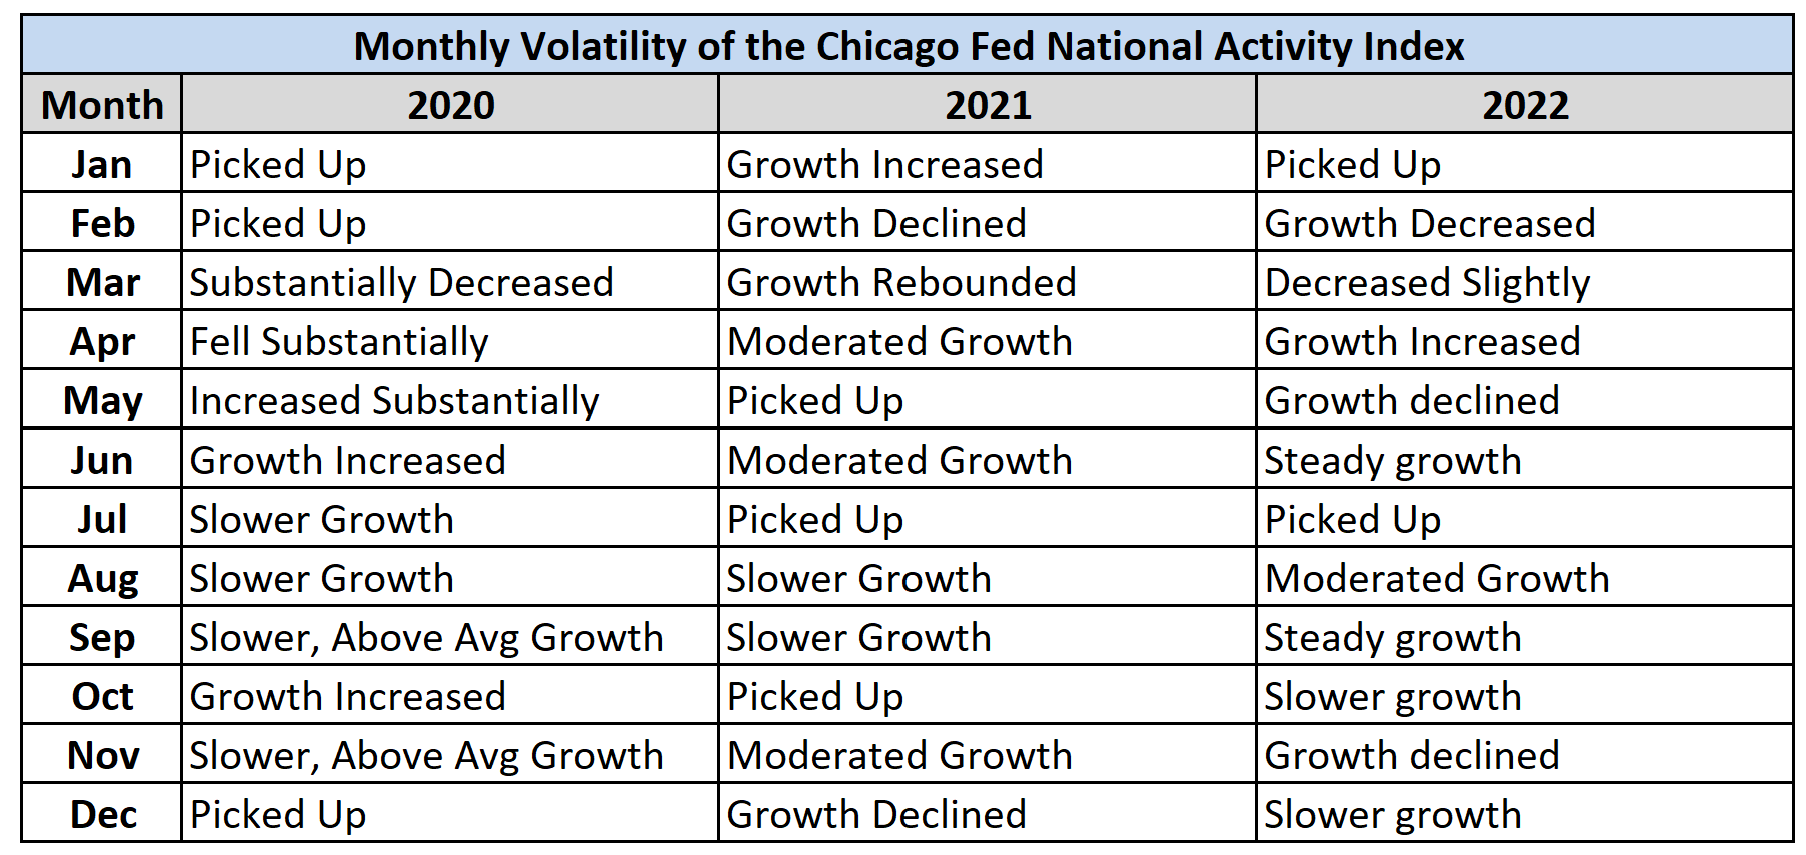
Further underscoring the volatility is the roller-coaster list of CFNAI monthly headlines from the last couple of years.
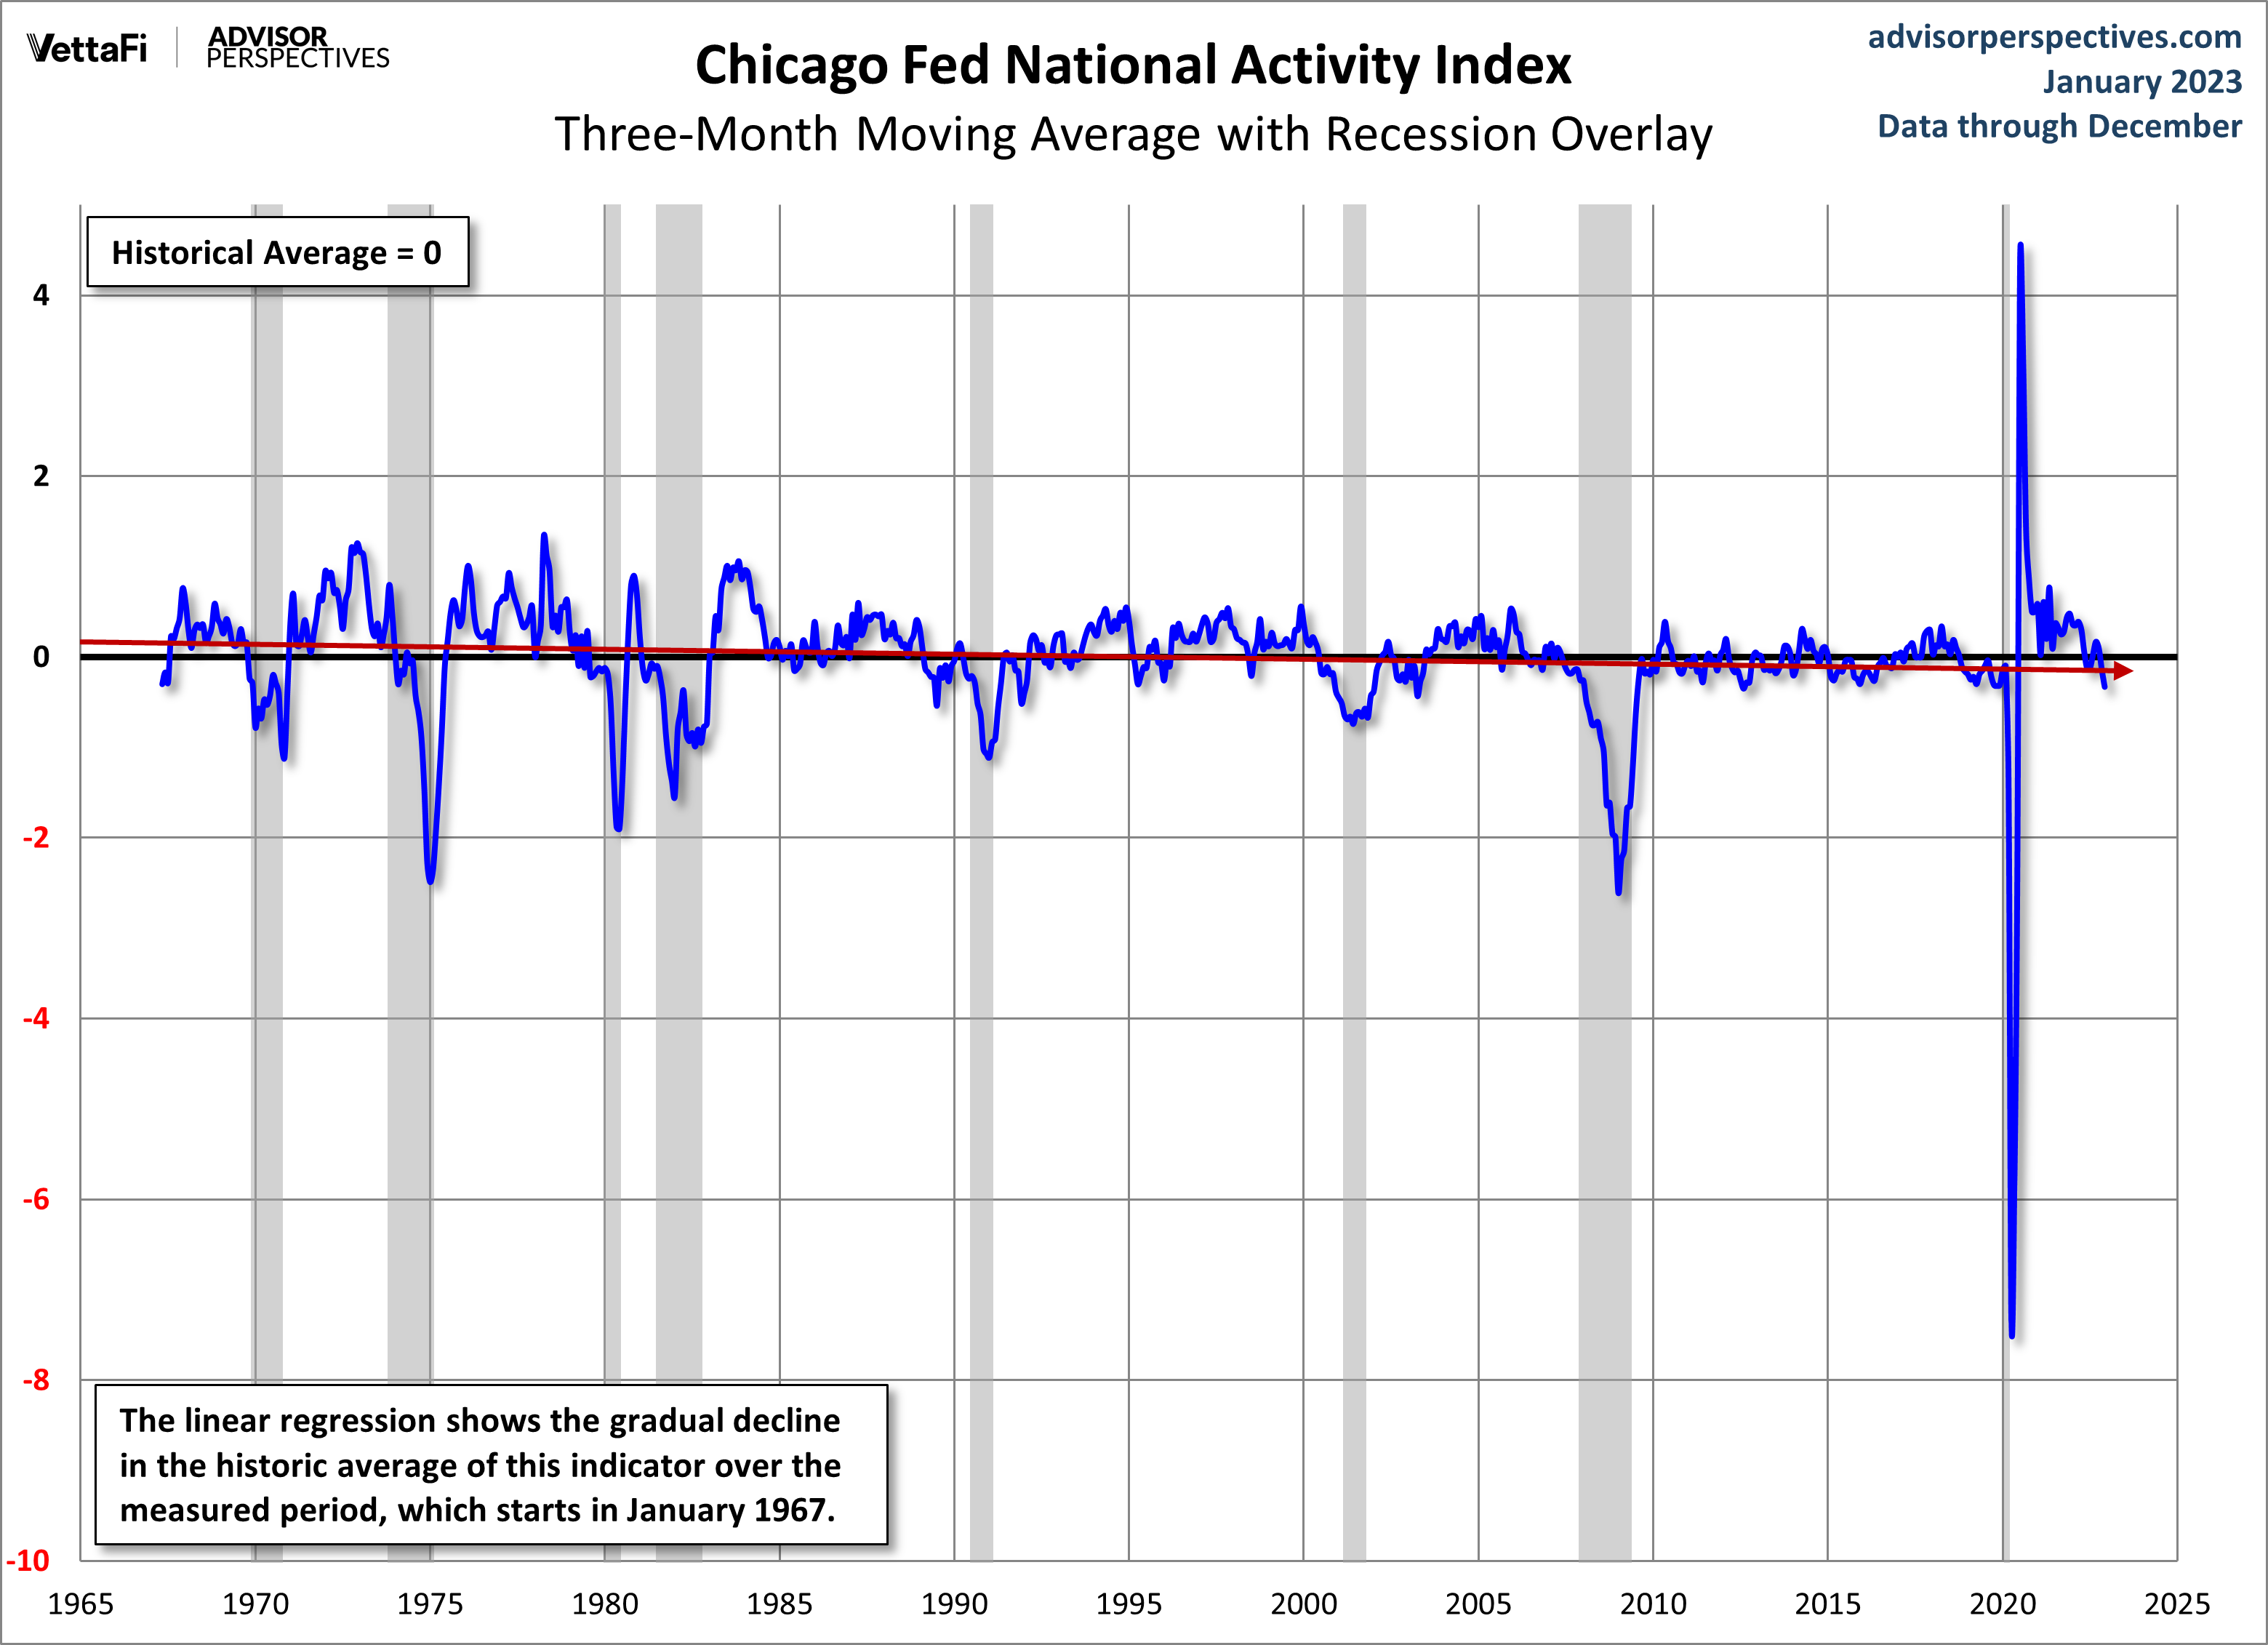
The long-term economic trend
In the final chart, I've let Excel draw a linear regression through the CFNAI data series. The slope confirms the casual impression of the previous charts that national activity, as a function of the 85 indicators in the index, has been declining since its inception in the late 1960s, a trend that roughly coincides with the transition from a good-producing to a post-industrial service economy in the information age.
More By This Author:
Q4 GDP Advanced Estimate: Real GDP At 2.9%, Better Than Forecast
Headline Durable Goods Orders Up 5.6% In December
Weekly Unemployment Claims: Down 6K, Better Than Forecast


Comments
Log in or sign up to join the conversation.