
I wanted to take a quick look at some of data points that really stand out. Enjoy!
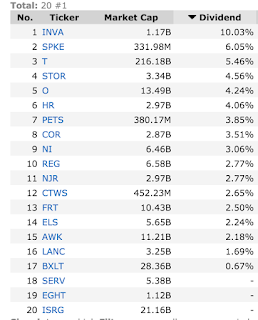
The key theme of the new highs list: yield. I wrote about the long term breakout in dividend stocks relative to the S&P 500 during the week. Although the ratio is stretched now, the theme is still set up to outperform through 2016.
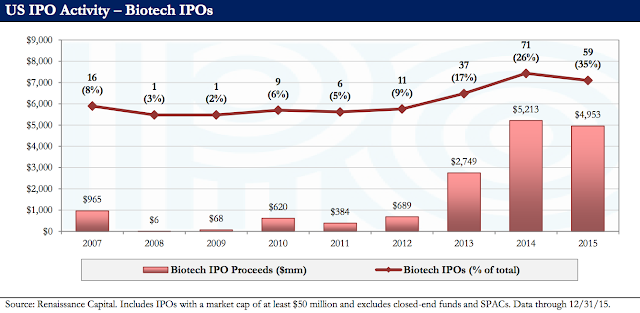
The IPO market data suggests Biotech was a bubble via Renaissance Capital

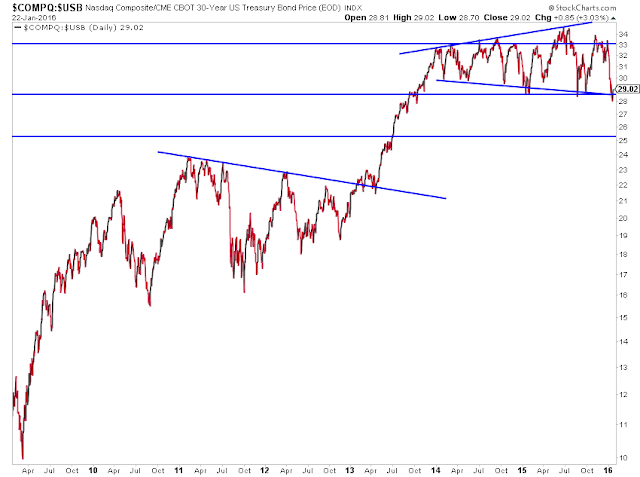
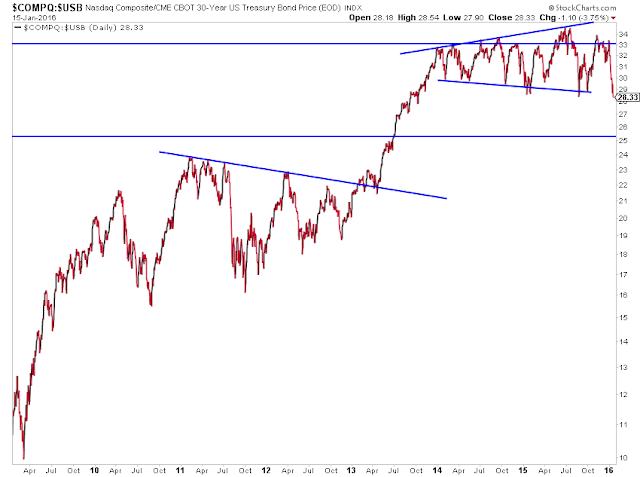
The stock to bond ratio is clinging to life at crucial support.
The consumer ratio has lost its multi-year uptrend. Can it recover?

We've reached panic levels in oil via Option Pit

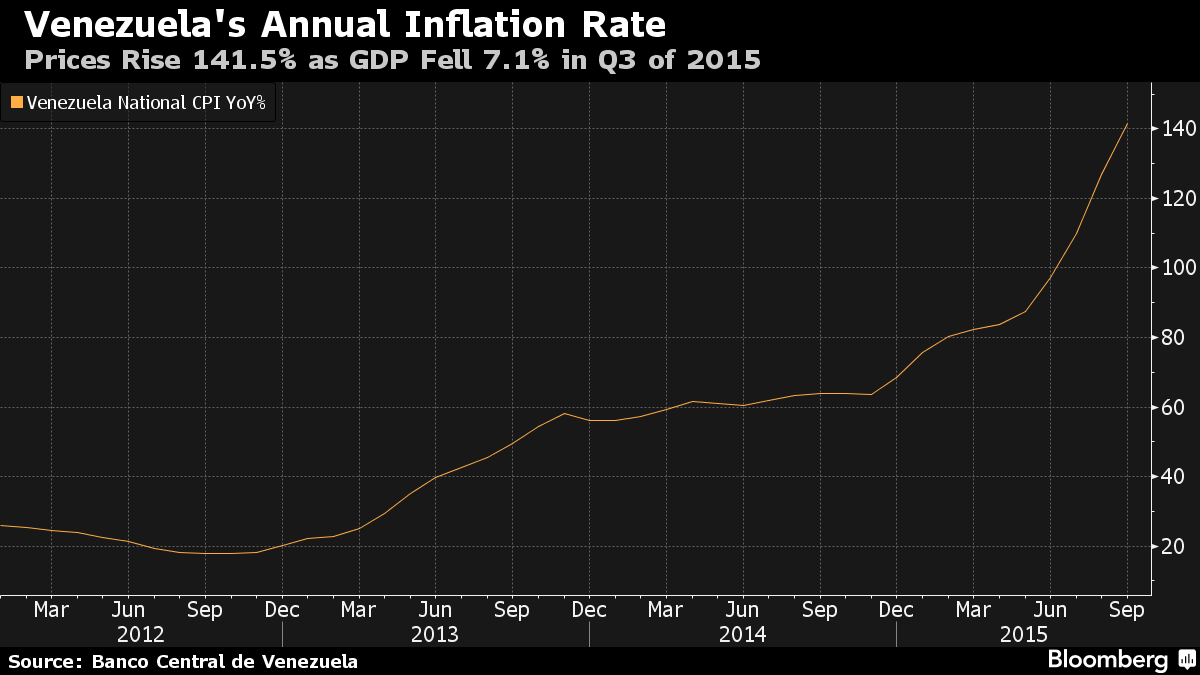
The IMF expects inflation in Venezuela to be 720% in 2016.
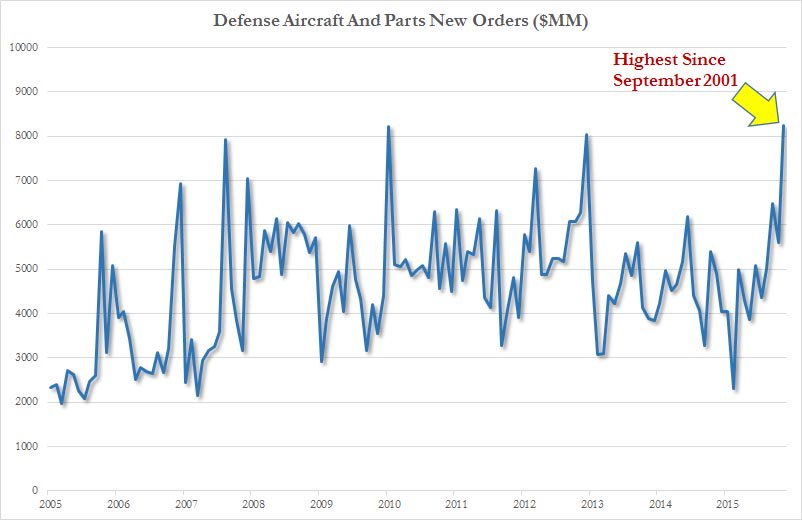
Defense aircraft spending is at a level not seen since 9/11 via @zerohedge
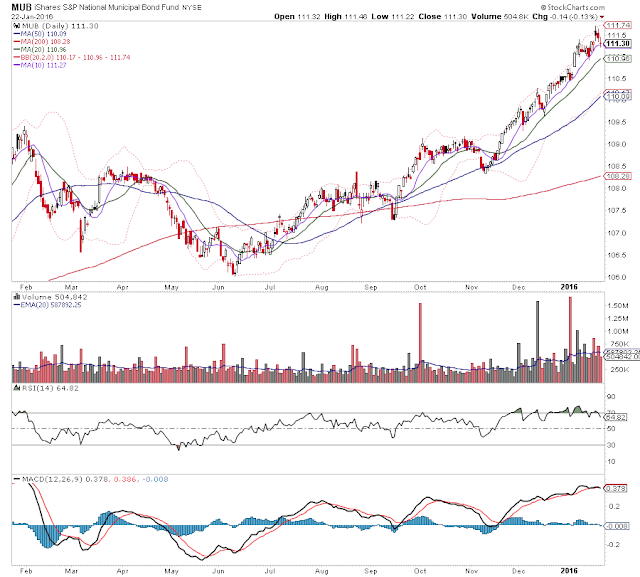
Muni Bonds (MUB) have performed as well as any asset over the past three months. The intermediate trend is losing momentum.
A monster executive shakeup at Twitter was just announced
$TWTR BREAKING: Twitter Bombshell Shakes the Market With Abrupt Changeshttps://t.co/LLofOB95rl pic.twitter.com/kHCyFqPdQG
— Ophir Gottlieb (@OphirGottlieb) January 24, 2016
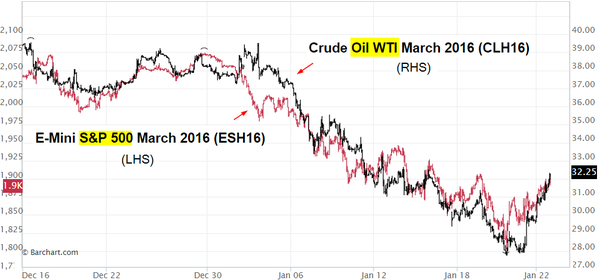
The stock market has been highly correlated to oil prices via SoberLook
The Forward P/E of the S&P 500 is 14.9 as we head into the meat of earnings season - FactSet

Jesse Felder notes this is now the worst possible environment for stocks
Thanks for reading


Comments
Log in or sign up to join the conversation.