
Charts That Matter- Tuesday, Feb. 12
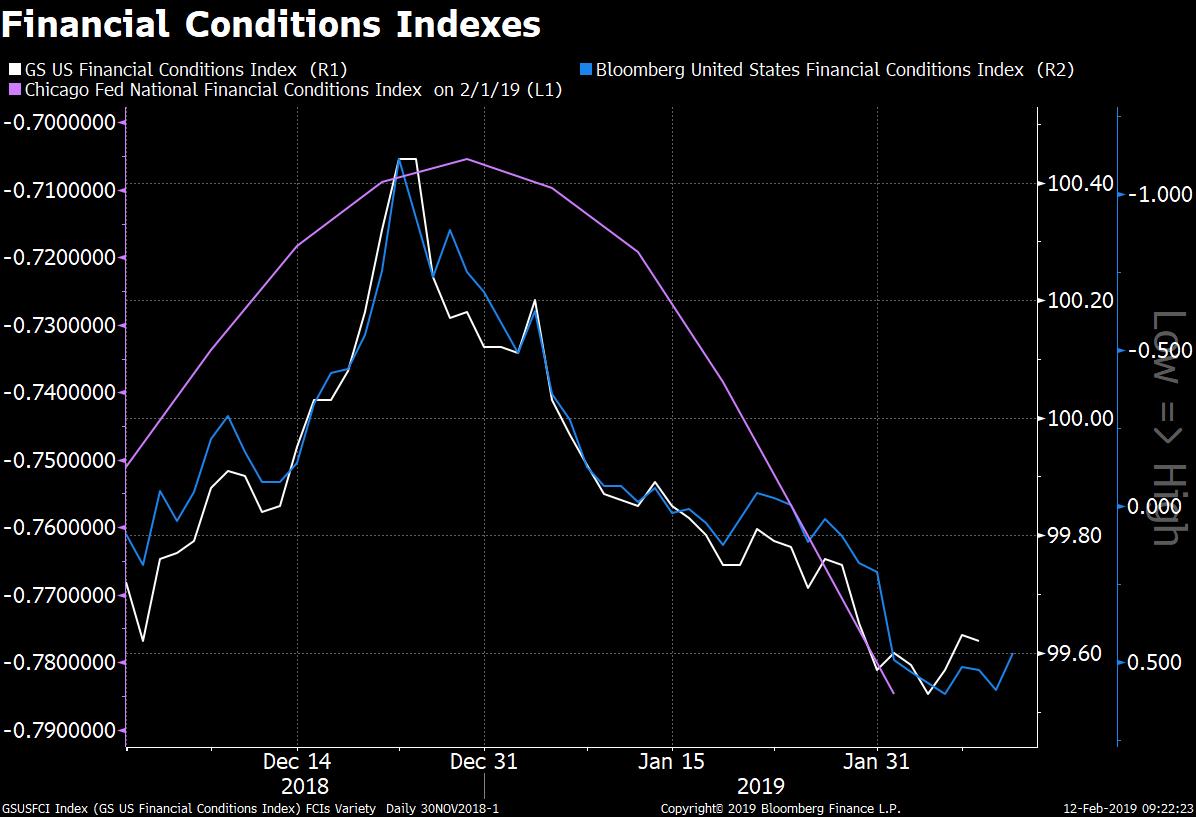
Financial conditions indexes are in easier territory now than they were at the start of December. Liquidity in the system has been improving since the US govt shutdown... why? because in shutdown US govt cannot borrow money from the market and has to run down its cash balances for emergency conditions… like shutdown. The loosening of the condition has coincided with a bottom in US equity markets as more LIQUIDITY is good for financial markets.
Conclusion: Shutdown is good for LIQUIDITY and LIQUIDITY is good for financial markets
(Click on image to enlarge)
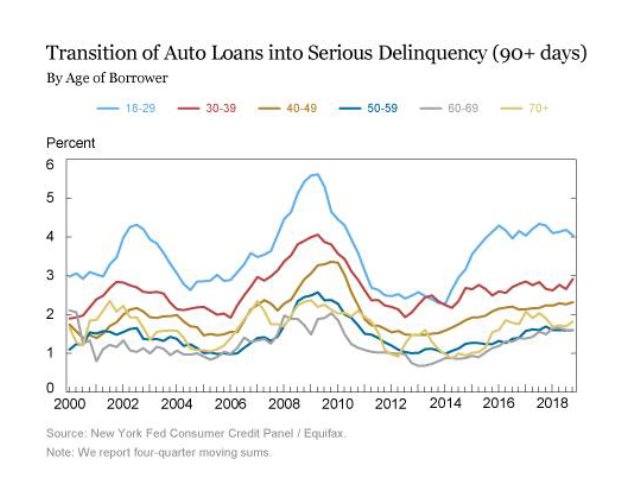
A record 7 million Americans are 90 days+ behind on their auto loan payments, a red flag for the economy, @NewYorkFed reports. It’s a million more people behind than during the financial crisis era. Many are under 30 years old and Powell just mentioned. “NATIONAL LEVEL DATA SAYS ECONOMY IS GOOD”
(Click on image to enlarge)
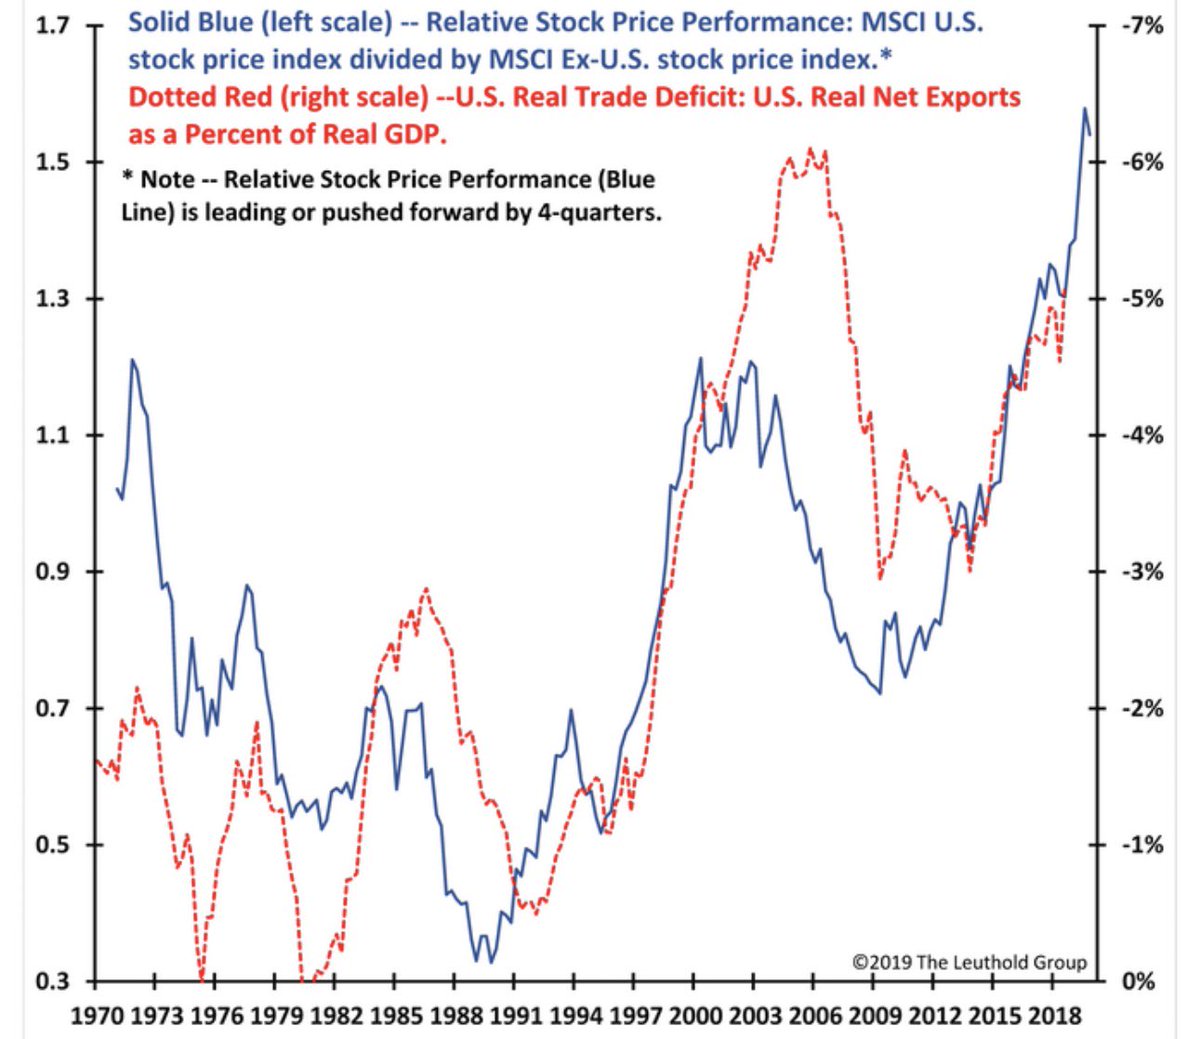
The close historical relationship between U.S. Trade Deficit & relative performance of U.S. stocks vs int’l stocks…believe it or not, since at least 1970, U.S. stocks have done best when trade deficit worsens @LeutholdGroup. You might have noticed that the US trade deficit has started shrinking … not again
Domestic/foreign stock exposure & U.S. trade deficit:
(Click on image to enlarge)
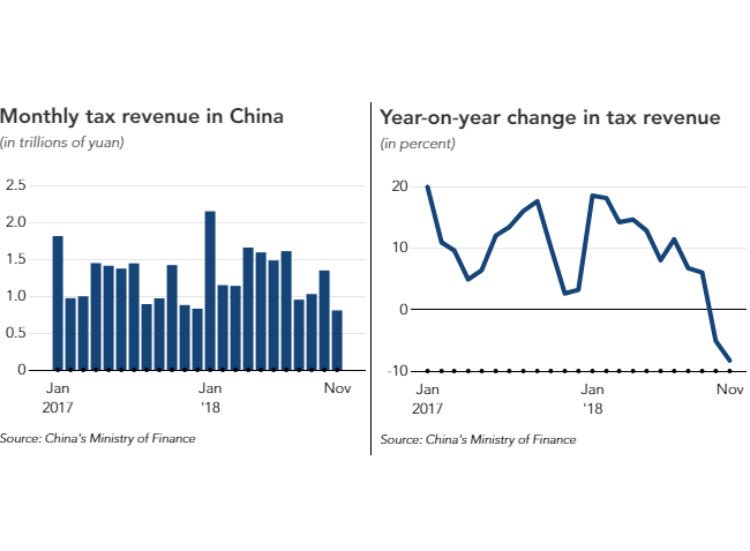
Chinese Tax revenue, post-tax cuts. The US tax refunds don’t look too dissimilar. Is it the case of money left in the hands of people or there is no income left to pay for taxes.
(Click on image to enlarge)


Interesting charts. That a larger trade deficit would help the US stock market is why China is still important to the world economy. Trump wants a deal to save the stock market. But he also wants China to do his will. He cannot have both!!!