

Image Source: Unsplash
This has been an unusual weekend. I took my daughter bowling yesterday (bad back and all) at the new alley near us. We probably go once a month, and she was very eager for me to bowl with her.
Typically, I watch her play. But I did bowl this time, and I was in my prime form in game No. 1. I bowled a 97, beating her by a whopping 16 points. Then, we started the second game. She bowled a 71, and I bowled a 203.

That has never happened before. Complete anomaly. I’ve never marked all 10 frames, and I’m not a very good bowler. My daughter was not at all interested in celebrating my success.
Third game? I bowled a 104. Then I spent the rest of the day playing Mario Kart in the arcade and trying to explain what an anomaly is. That’s been a theme of the week, anyway.
With Momentum Red
It was Nov. 13 when our S&P 500 signal went red (negative), a warning sign for the market. Our Russell 2000 reading, after a period of choppiness in October, went negative on Oct. 30. Since both dates, the markets haven’t recovered.
Now, I’ve said a few times that I have no idea why the readings go red until a week or two later, but this was one of the rare times when we were able to see the cracks in the repo markets.
I’m going to admit that I don’t really think I’m engaging in brain surgery when it comes to the simple math of the market. This is an equation we use, and it’s no different from any physics formula for measuring gravity or a metric for measuring force.
It works because it’s not an algorithm, it’s not a model, and it’s not some hunch. It’s a measure of performance relative to a bell curve of all stocks listed in the market. And as we know, since stocks rise and fall all the time, sudden movements on the edges tell us something important: Leverage is leaving the system.
There are still skeptics, and I get it. But I’ll give you the basics really quick. I have been influenced by incredible mathematicians like Wes Grey, Gary Antonacci, and JD Henning, as well as by the work I’ve done with Tim Melvin on measuring MACD and other oscillators. The math is really simple. You can do it yourself if you really feel like figuring out all the different betas and coefficients for each sector. But if you want to do the math yourself to identify possible warning signs, just take the number of stocks that are up 5% on the week, up on the month, and have a Beta over 1.
This is A. Then take the number of stocks down 5% on the week, down on the month, and with a Beta over 1. This is B. If A is smaller than B, look at the FNGD. If the FNGD is over the 20-day moving average, be very cautious. If it’s over the 50-day moving average, there’s a problem.
That’s the poor man’s version of this. Or if you want to build your own system, you can read Henning’s Ph.D dissertation, which is probably the single most important academic study in finance this century.
Now, we’re only a little more than 4% from all-time highs on the S&P 500, but you can sense the panic. The more speculative, higher beta names are getting hit hard, and anyone who recommended names like Rigetti Computing (RGTI) into this negative momentum event is probably looking pretty foolish right now.
That’s why you follow these signals. That’s why this is a newsletter that can be sold. It acts as insurance. If someone tells you to buy something with a high beta and this signal is red, you wait until it goes green. That’s it. I can’t stress this enough. If you’re not following our reading in the morning and getting the updates, I encourage you to join us. You get a write up every morning, and if there are changes, you get a quick intraday update.
Now that we’re a good week and a half since the signal went negative, let’s look at what’s happened since.
As I said, I’ve warned about Japan and the repo markets for months, and it was just a matter of time. But as you likely saw, it took two months for this all to shake out. Which is why I never bet against the equation. I don’t guess.
Let’s look at the aftermath of the negative signals.
Chart 1: Momentum Crushed
The signal went negative. The selling pressure intensified. And then, momentum stocks had their worst week since the height of the GILT Crisis in November 2022. Here’s the Goldman Sachs high-beta basket taking a nose dive.
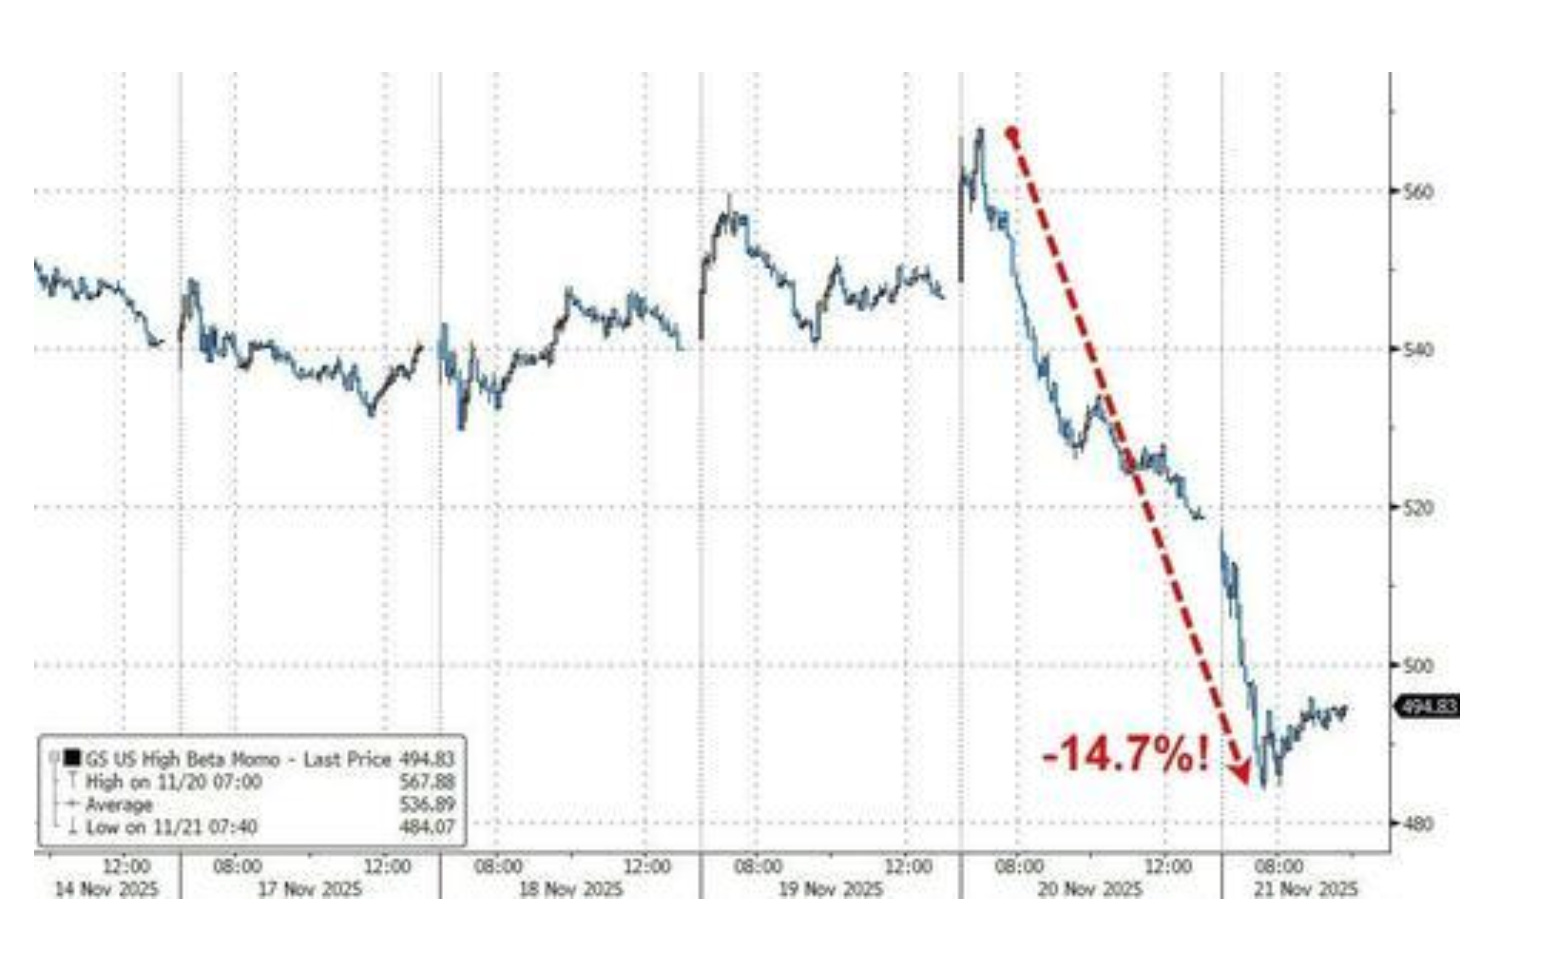
(Click on image to enlarge)
Again, it’s all an equation. Money in, money out, and it’s very predictive. I said last week that I was building a bigger cash pile. Now we wait to see if the Bank of Japan will get to work to stabilize things, or if the Fed’s going to have to step in and help.
I know that our reading chopped for a few weeks, but these big drawdown weeks only happen when the signal has gone red first. The really important thing about this is that we don’t know why until we actually do the autopsy.
On June 8, 2022, we witnessed a similar event. This reading went negative, and the S&P 500 fell by 15% in a week and a half. It wasn’t until nine days later that the Commitment of Traders report confirmed the largest hedge fund selloff in 15 years.
Chart No. 2: Volatility Swelled
Same story here. You can watch the FNGD or you can watch the UVXY. Both provide good clues for volatility and deleveraging. We don’t really see the VIX go above 20 until it turns red because the reading appears to measure deleveraging.
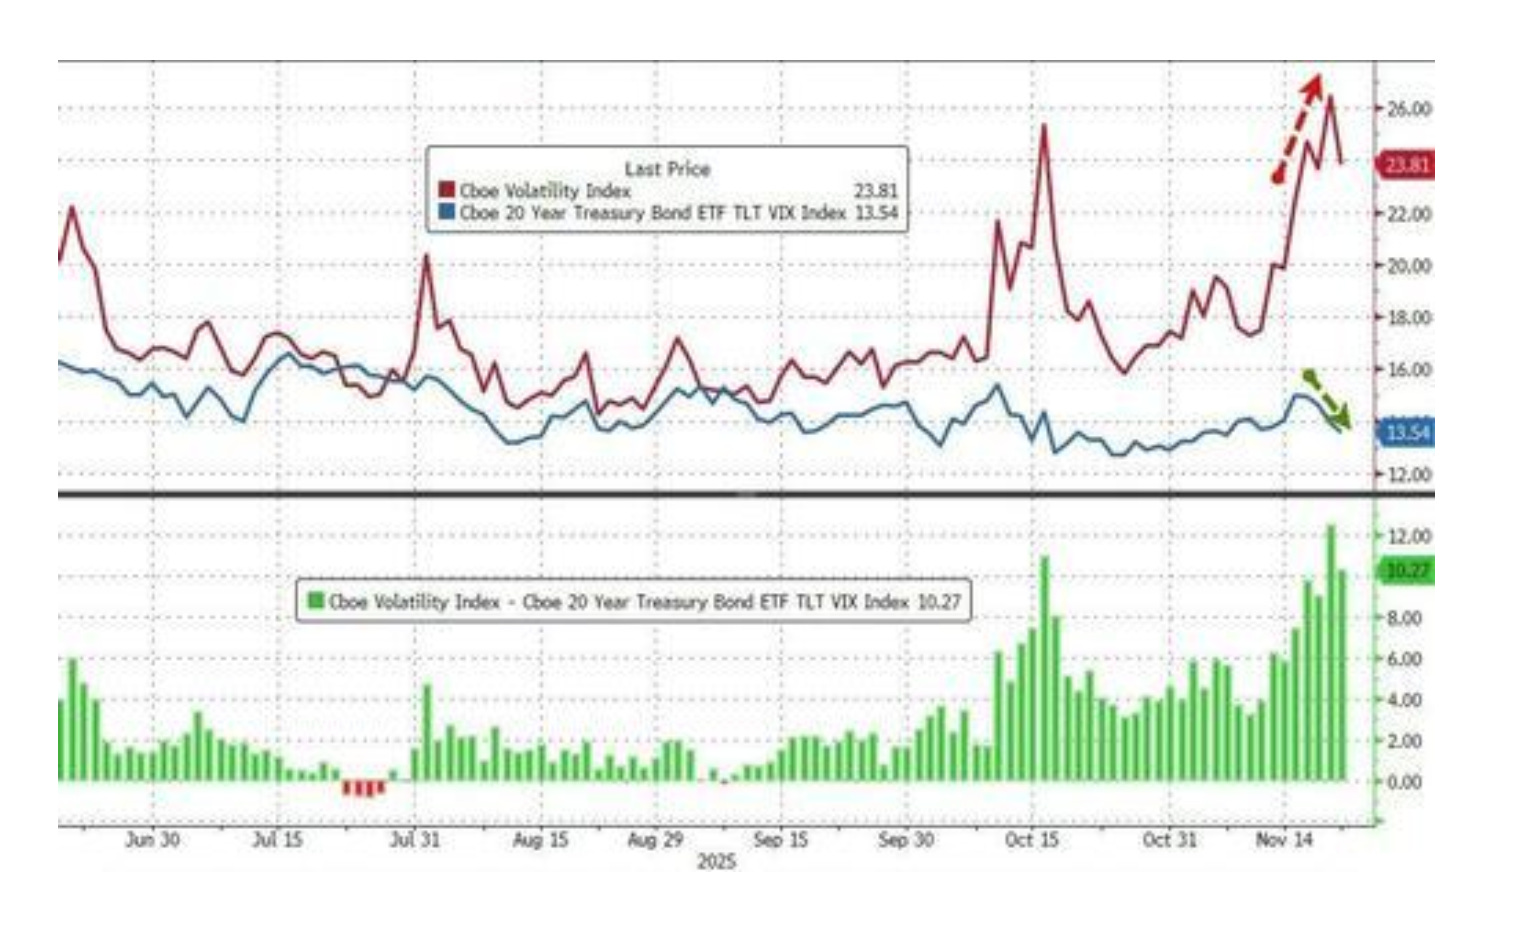
(Click on image to enlarge)
It’s more of a liquidity measurement than I thought.
Chart 3: A Big Intraday Reversal
This is important. We’ve seen the number of breakout stocks on the poor man’s equation hit this week. That’s a contrarian bull case. We saw insider buying to selling hit the highest level in real dollars since April. That’s a contrarian bull case.
We saw Japan announce accommodation to the markets. That’s a bull case. But we also just saw a big intraday reversal.
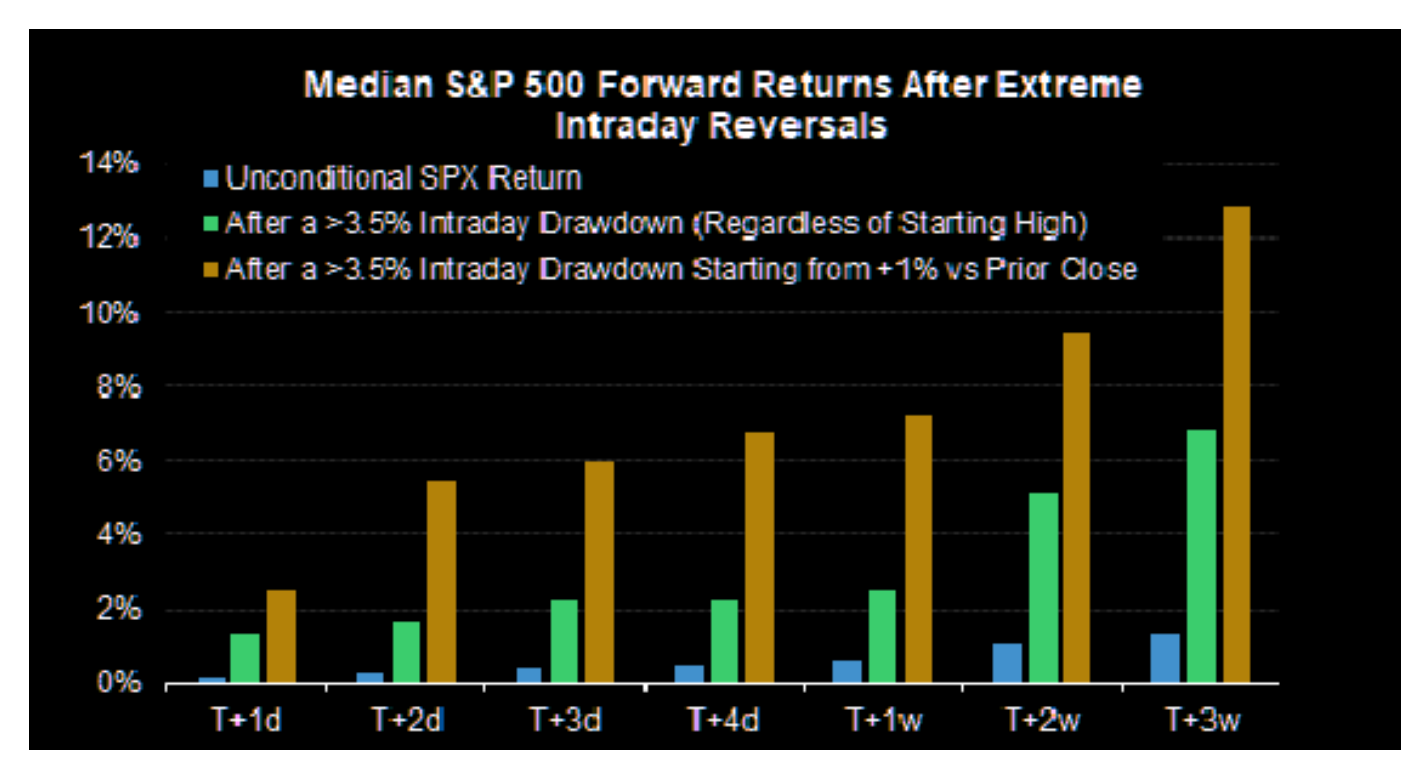
(Click on image to enlarge)
If you’re looking for a bull case, it's pretty much here.
Chart No. 4: But The Bear Case is Here
There’s another side to this. Goldman did point out that CTAs could dump another $220 billion in stocks if there’s continued pressure.
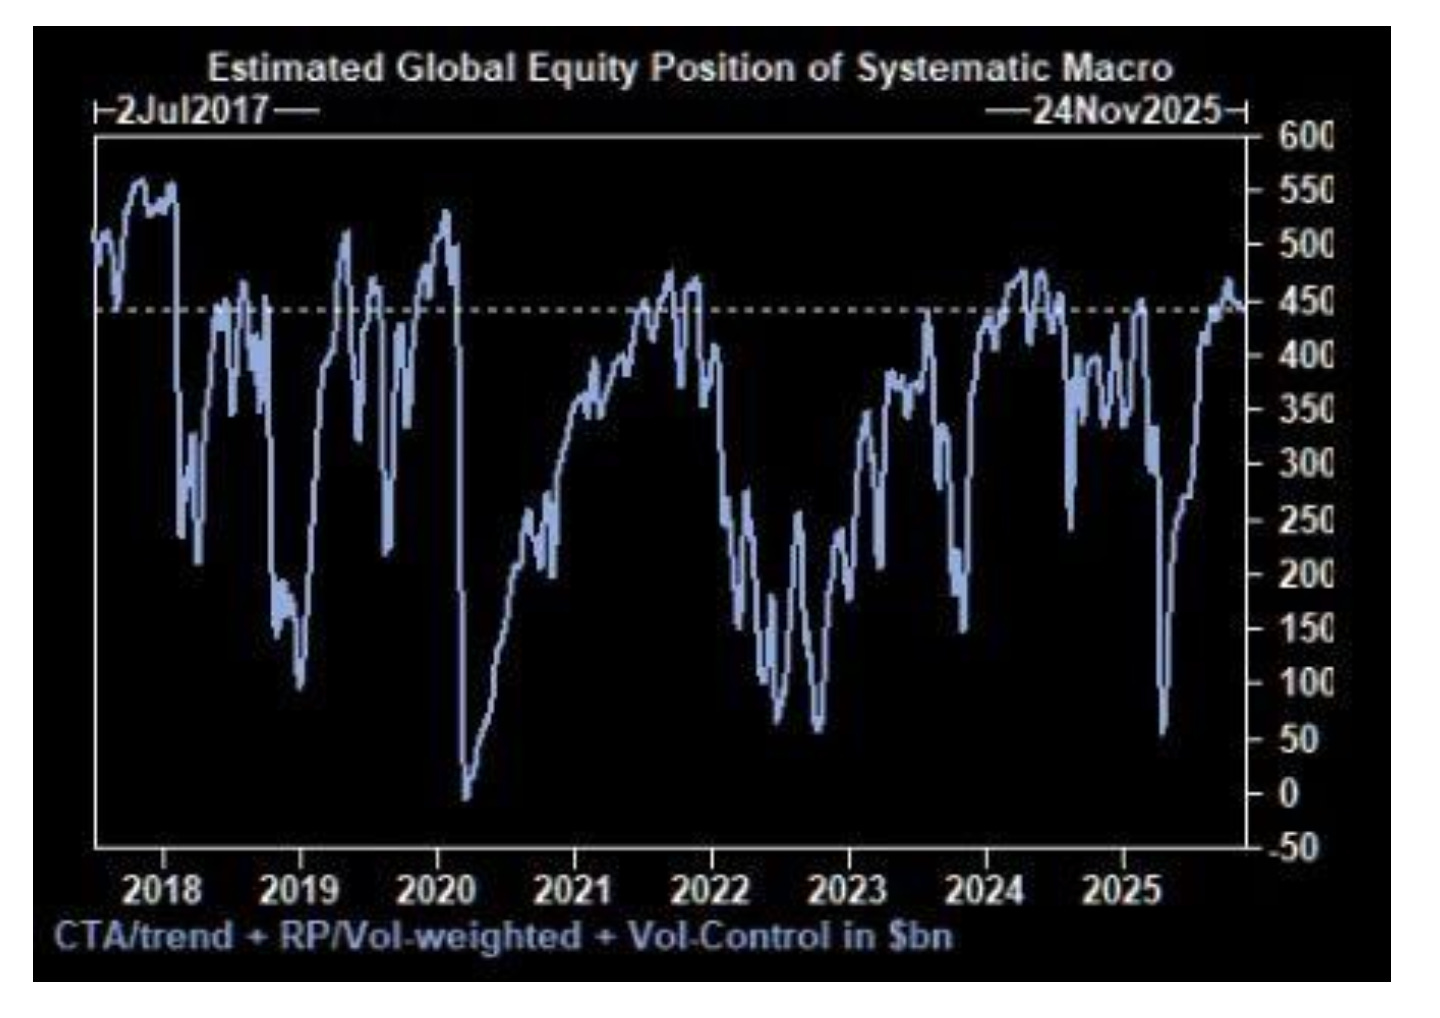
(Click on image to enlarge)
So, what are we looking for on the bullish side or the bearish side?
On the bull side, you need to see multiple days of buying, and the number of stocks in that breakout equation rising. You’d need to see the equity markets push back above key moving averages. But you also need to make sure you keep an eye on those averages, like the 20-day EMA. The danger remains the same.
The CTAs could use any upward momentum to sell back into that pressure. So, obey the signal. If it goes green and red again, get out of the way. It’s okay if we get faked out, but it would be mad to try to buy and then hold through downward pressure.
Finally: This is Important
What’s driving the tape? It’s not value arbitrage, it’s the passive investors.
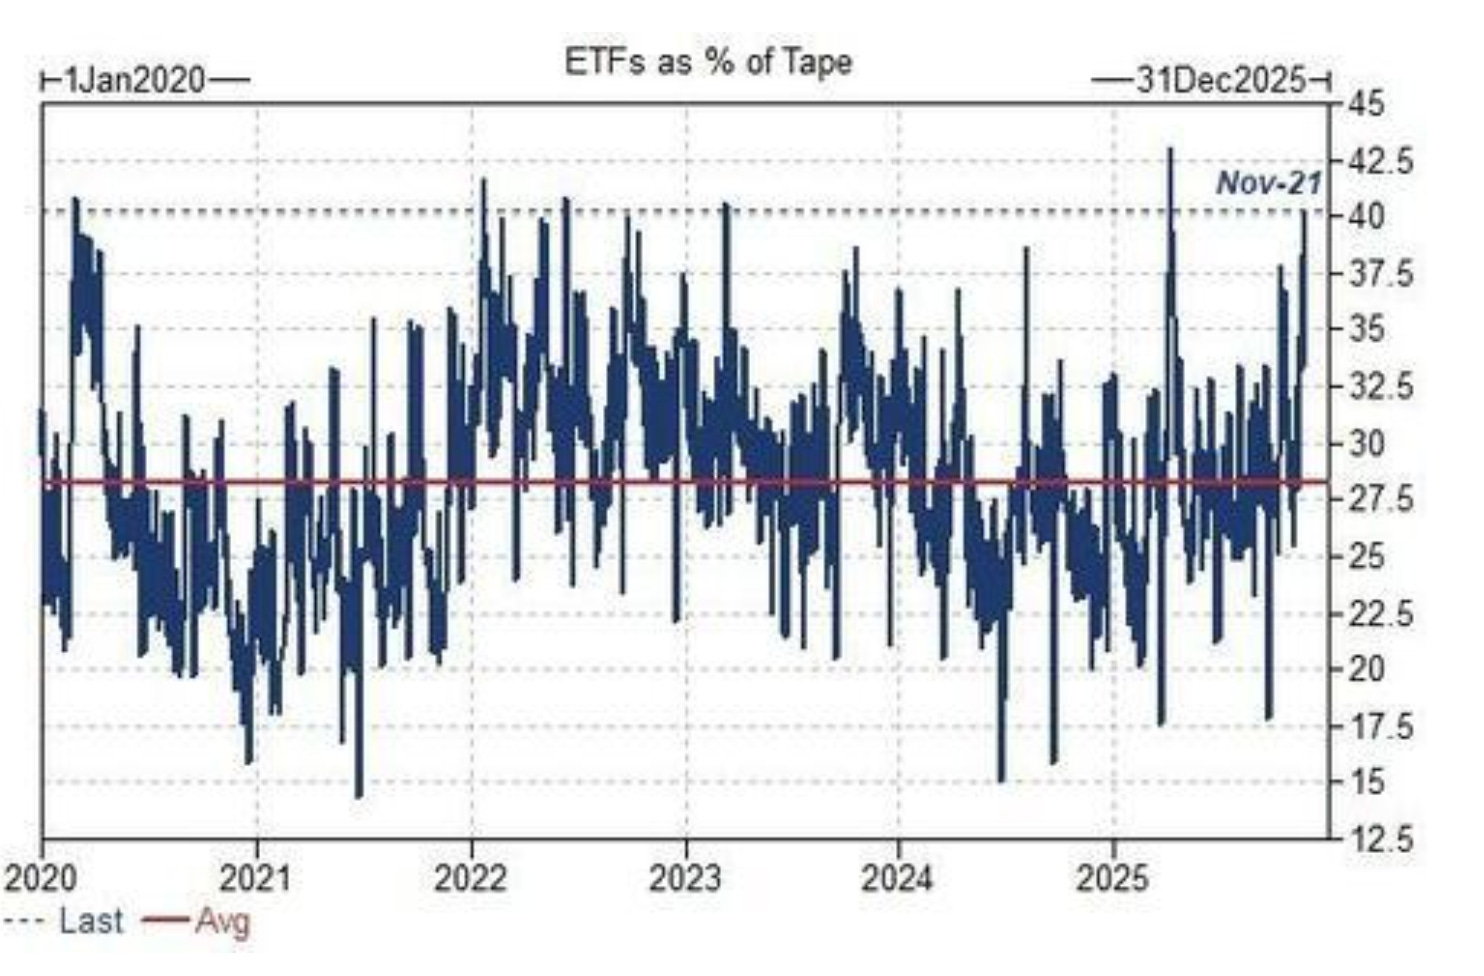
(Click on image to enlarge)
ETFs are 40% of the tape, and top book liquidity is in the dog house. Look, we’re not out of the woods yet.
What’s Up This Week?
- Monday, Nov. 24: MSCI index changes take effect at 9:00 AM - when CoreWeave, Nebius Group, and Insmed get added to the MSCI World Index, that’s billions in passive flows hitting at market open. In this liquidity environment, forced buying could move markets more than fundamentals.
- Tuesday, Nov. 25: Dell’s earnings call at 4:30 PM - options are pricing a 10% swing, and Intel has moved in lockstep with Dell for eight straight reports. In a week where AI infrastructure is under pressure, this could be the domino that matters.
- Wednesday, Nov. 26: Fed’s Beige Book at 2:00 PM - with officials split on December cuts and repo markets seizing up, this anecdotal snapshot of regional conditions could tip the scales on whether Powell’s crew has any clue what’s actually happening in the economy.
- Thursday, Nov. 27: US markets are closed for Thanksgiving, but watch the overnight futures and Asian markets - if Japan’s currency crisis escalates while Americans are carving turkey, we could wake up on Friday to a very different world.
- Friday, Nov. 28: OPEC+ meeting looms Sunday - with markets closing early at 1:00 PM and oil in focus ahead of the Nov. 30 production strategy meeting, energy sector moves could set the tone for how commodity inflation fears play into December Fed decisions.
And finally, my Postcards segment comes back next week. But now’s a good time to be looking at my Insider Buying Report as well. Insider buying has picked up in recent days, and there’s lots of value being scooped up right now.
More By This Author:
Two Insider Buys That Caught My AttentionBuffett's Alphabet Stake Fits The "Every Buyer" Portfolio Strategy
A 50 Basis Point Cut In October?


Comments
Log in or sign up to join the conversation.