
Charted: Four Decades of U.S. Inflation
In May 2022, the annual rate of U.S. inflation grew to 8.6%—the highest it’s been in four decades, according to the Bureau of Labor Statistics.

Pixabay
What’s driving this surge, and what products are seeing the most significant price jumps?
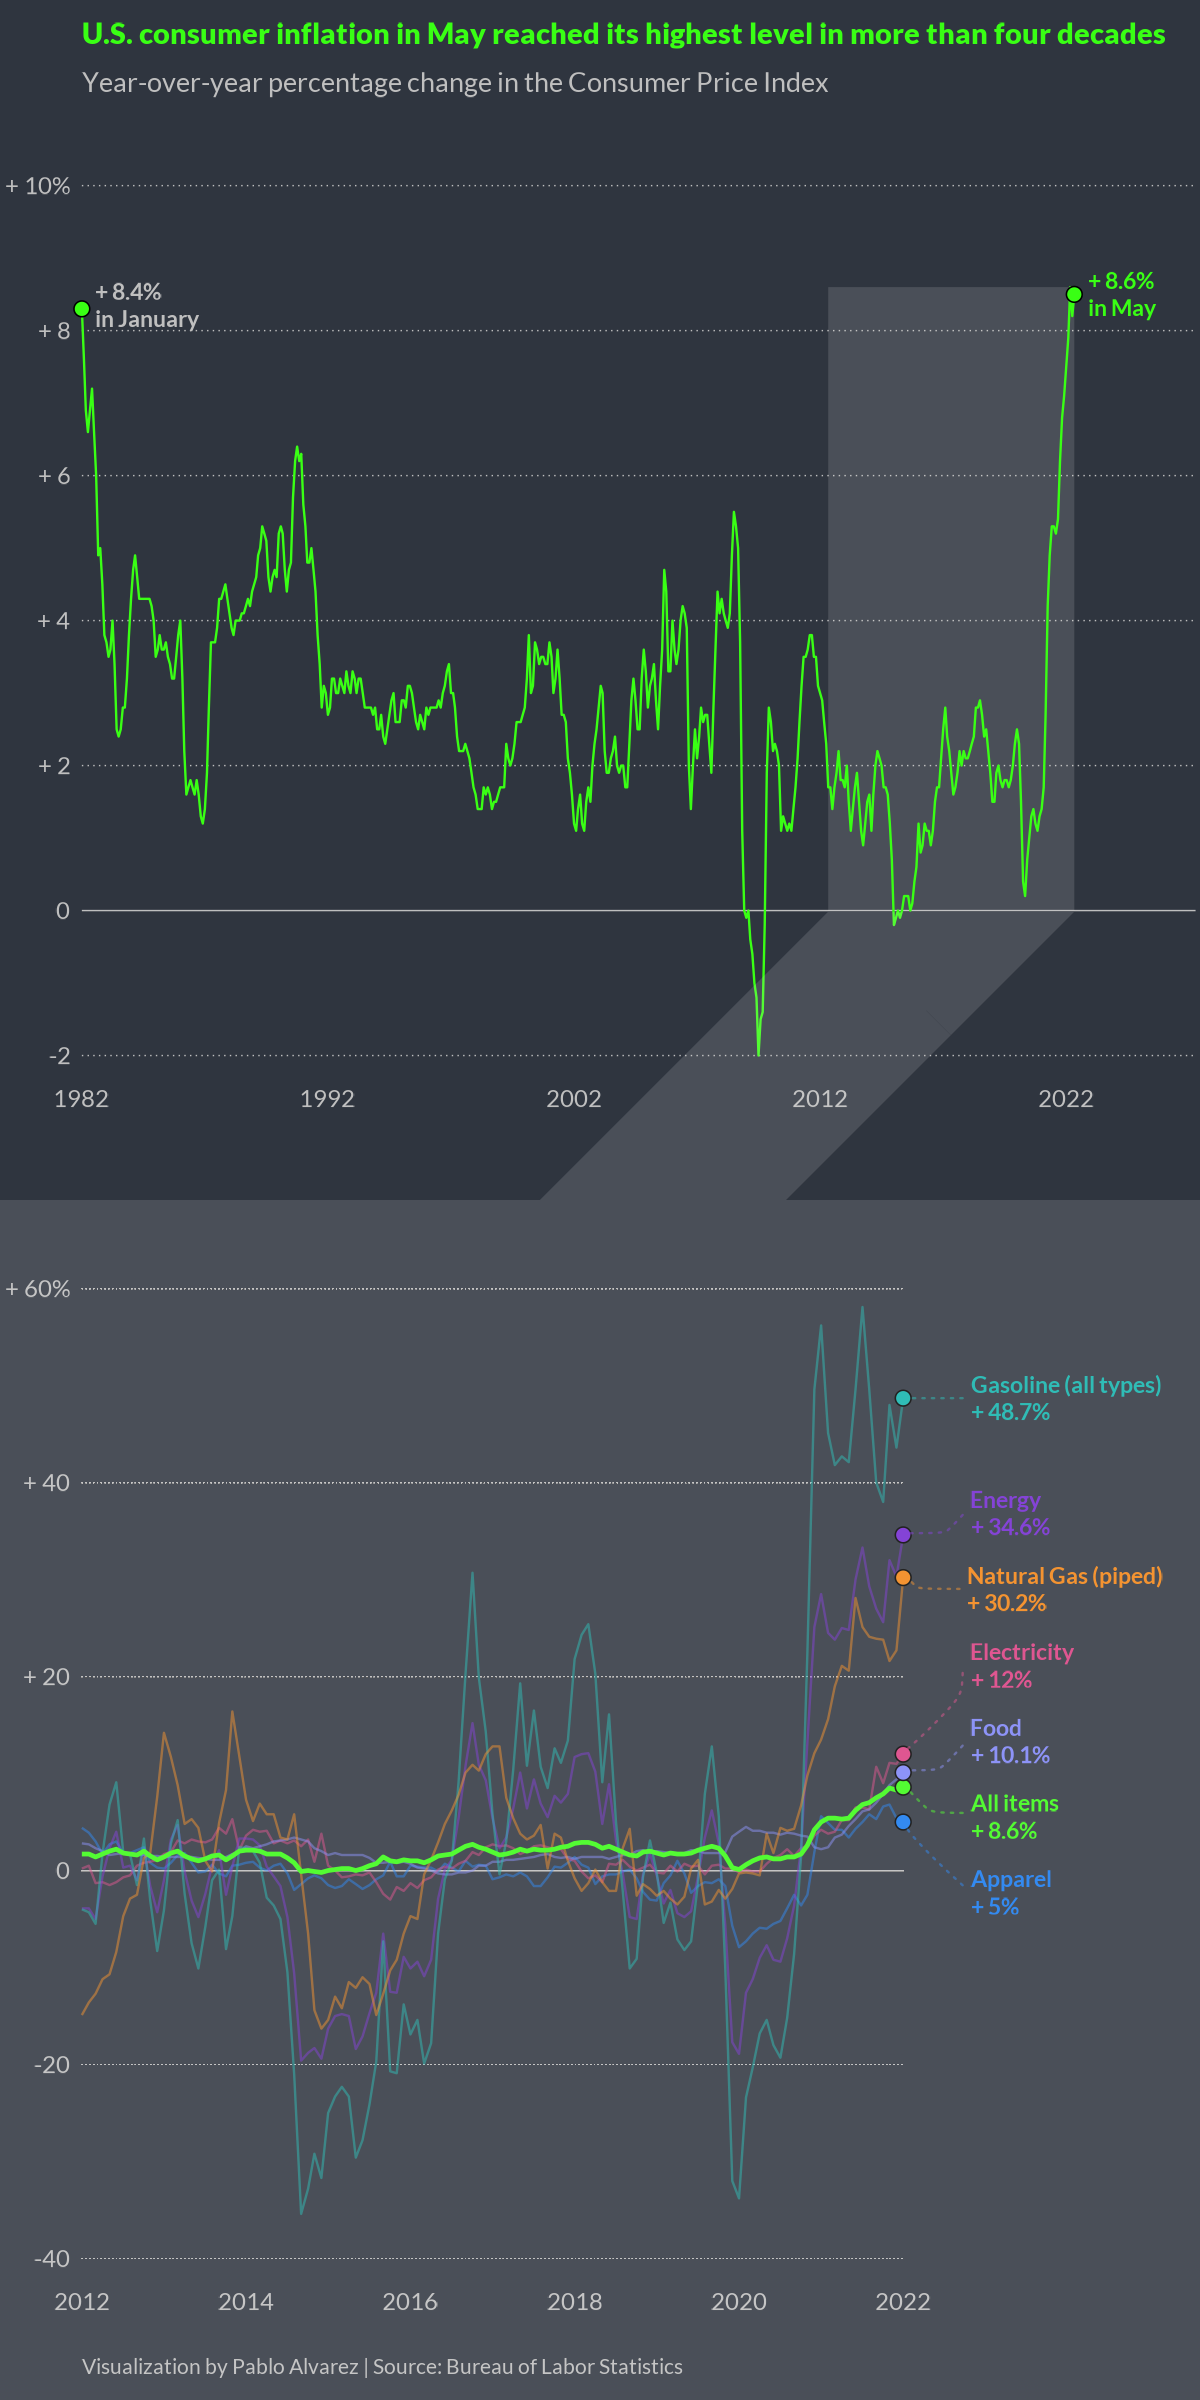
This visualization by Pablo Alvarez shows U.S. inflation levels since 1982 and highlights a few product categories that have seen the biggest year-over-year increases.
The Category Breakdown
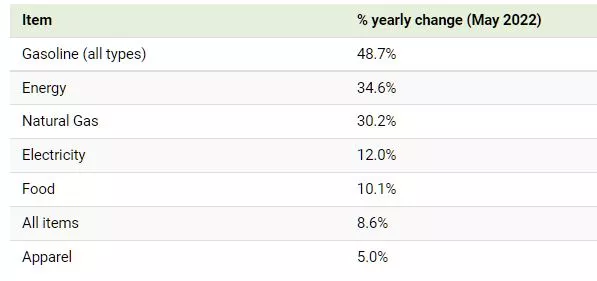
Perhaps unsurprisingly, energy sources have seen the biggest year-over-year climb. Gasoline has seen one of the biggest spikes, up 48.7% since May 2021.
Across the U.S., the average price of gas sat at $4.807 per gallon as of July 4, and experts predict this figure could grow to $6 per gallon by the end of the summer.
While fuel prices were on the upswing prior to the Russia-Ukraine conflict, due to loosening COVID-19 restrictions and increased demand for travel, the conflict sent oil prices skyrocketing. This is because many countries placed sanctions on Russian oil, which put a squeeze on global supply.
Food has also seen a massive cost spike, up 10.1% since May 2021. This is largely due to supply-chain issues, increased transportation costs, and fertilizer shortages.
The Spending Spree Continues
Despite rising prices, many consumers have been continuing to spend. In May 2022, personal consumption expenditures (which account for inflation) were up 0.5% compared to the month prior, according to the Bureau of Economic Analysis.
Rather than adjust their spending habits, Americans have been relying on their savings to cope with price hikes. A recent survey of over 2,000 Americans showed that 67% of respondents have used some of their savings to deal with price increases, and 23% have made a substantial dent in their nest eggs.
To help combat inflation, central banks have been raising interest rates to encourage savings and ultimately slow down spending. But this is a delicate dance—if rates are raised too fast and spending screeches to a halt, this could lead to a recession.
More By This Author:
Household Income Distribution in the U.S. Visualized as 100 HomesVisualizing The Current State Of The Global Gender Gap
Interest Rate Hikes vs. Inflation Rate, by Country


Comments
Log in or sign up to join the conversation.