
The latest Conference Board Leading Economic Index (LEI) for June was down 0.8% from the May final figure of 118.0.
New York, July 21, 2022… The Conference Board Leading Economic Index® (LEI) for theU.S. decreased by 0.8 percent in June 2022 to 117.1 (2016=100), after declining by 0.6 percent in May. The LEI was down by 1.8 percent over the first half of 2022, a reversal from its 3.3 percent growth over the second half of 2021.
"The US LEI declined for a fourth consecutive month suggesting economic growth is likely to slow further in the near-term as recession risks grow,” said Ataman Ozyildirim, Senior Director of Economic Research at The Conference Board. “Consumer pessimism about future business conditions, moderating labor market conditions, falling stock prices, and weaker manufacturing new orders drove the LEI’s decline in June. The coincident economic index which rose in June suggests the economy grew through the second quarter. However, the forward-looking LEI points to a US economic downturn ahead.”
“Amid high inflation and rapidly tightening monetary policy, The Conference Board expects economic growth will continue to cool throughout 2022. A US recession around the end of this year and early next is now likely. Accordingly, we’ve downgraded our forecast of 2022 annual Real GDP growth to 1.7 percent year-over-year (from 2.3 percent), while 2023 growth was downgraded to 0.5 percent YOY (from 1.8 percent).” More
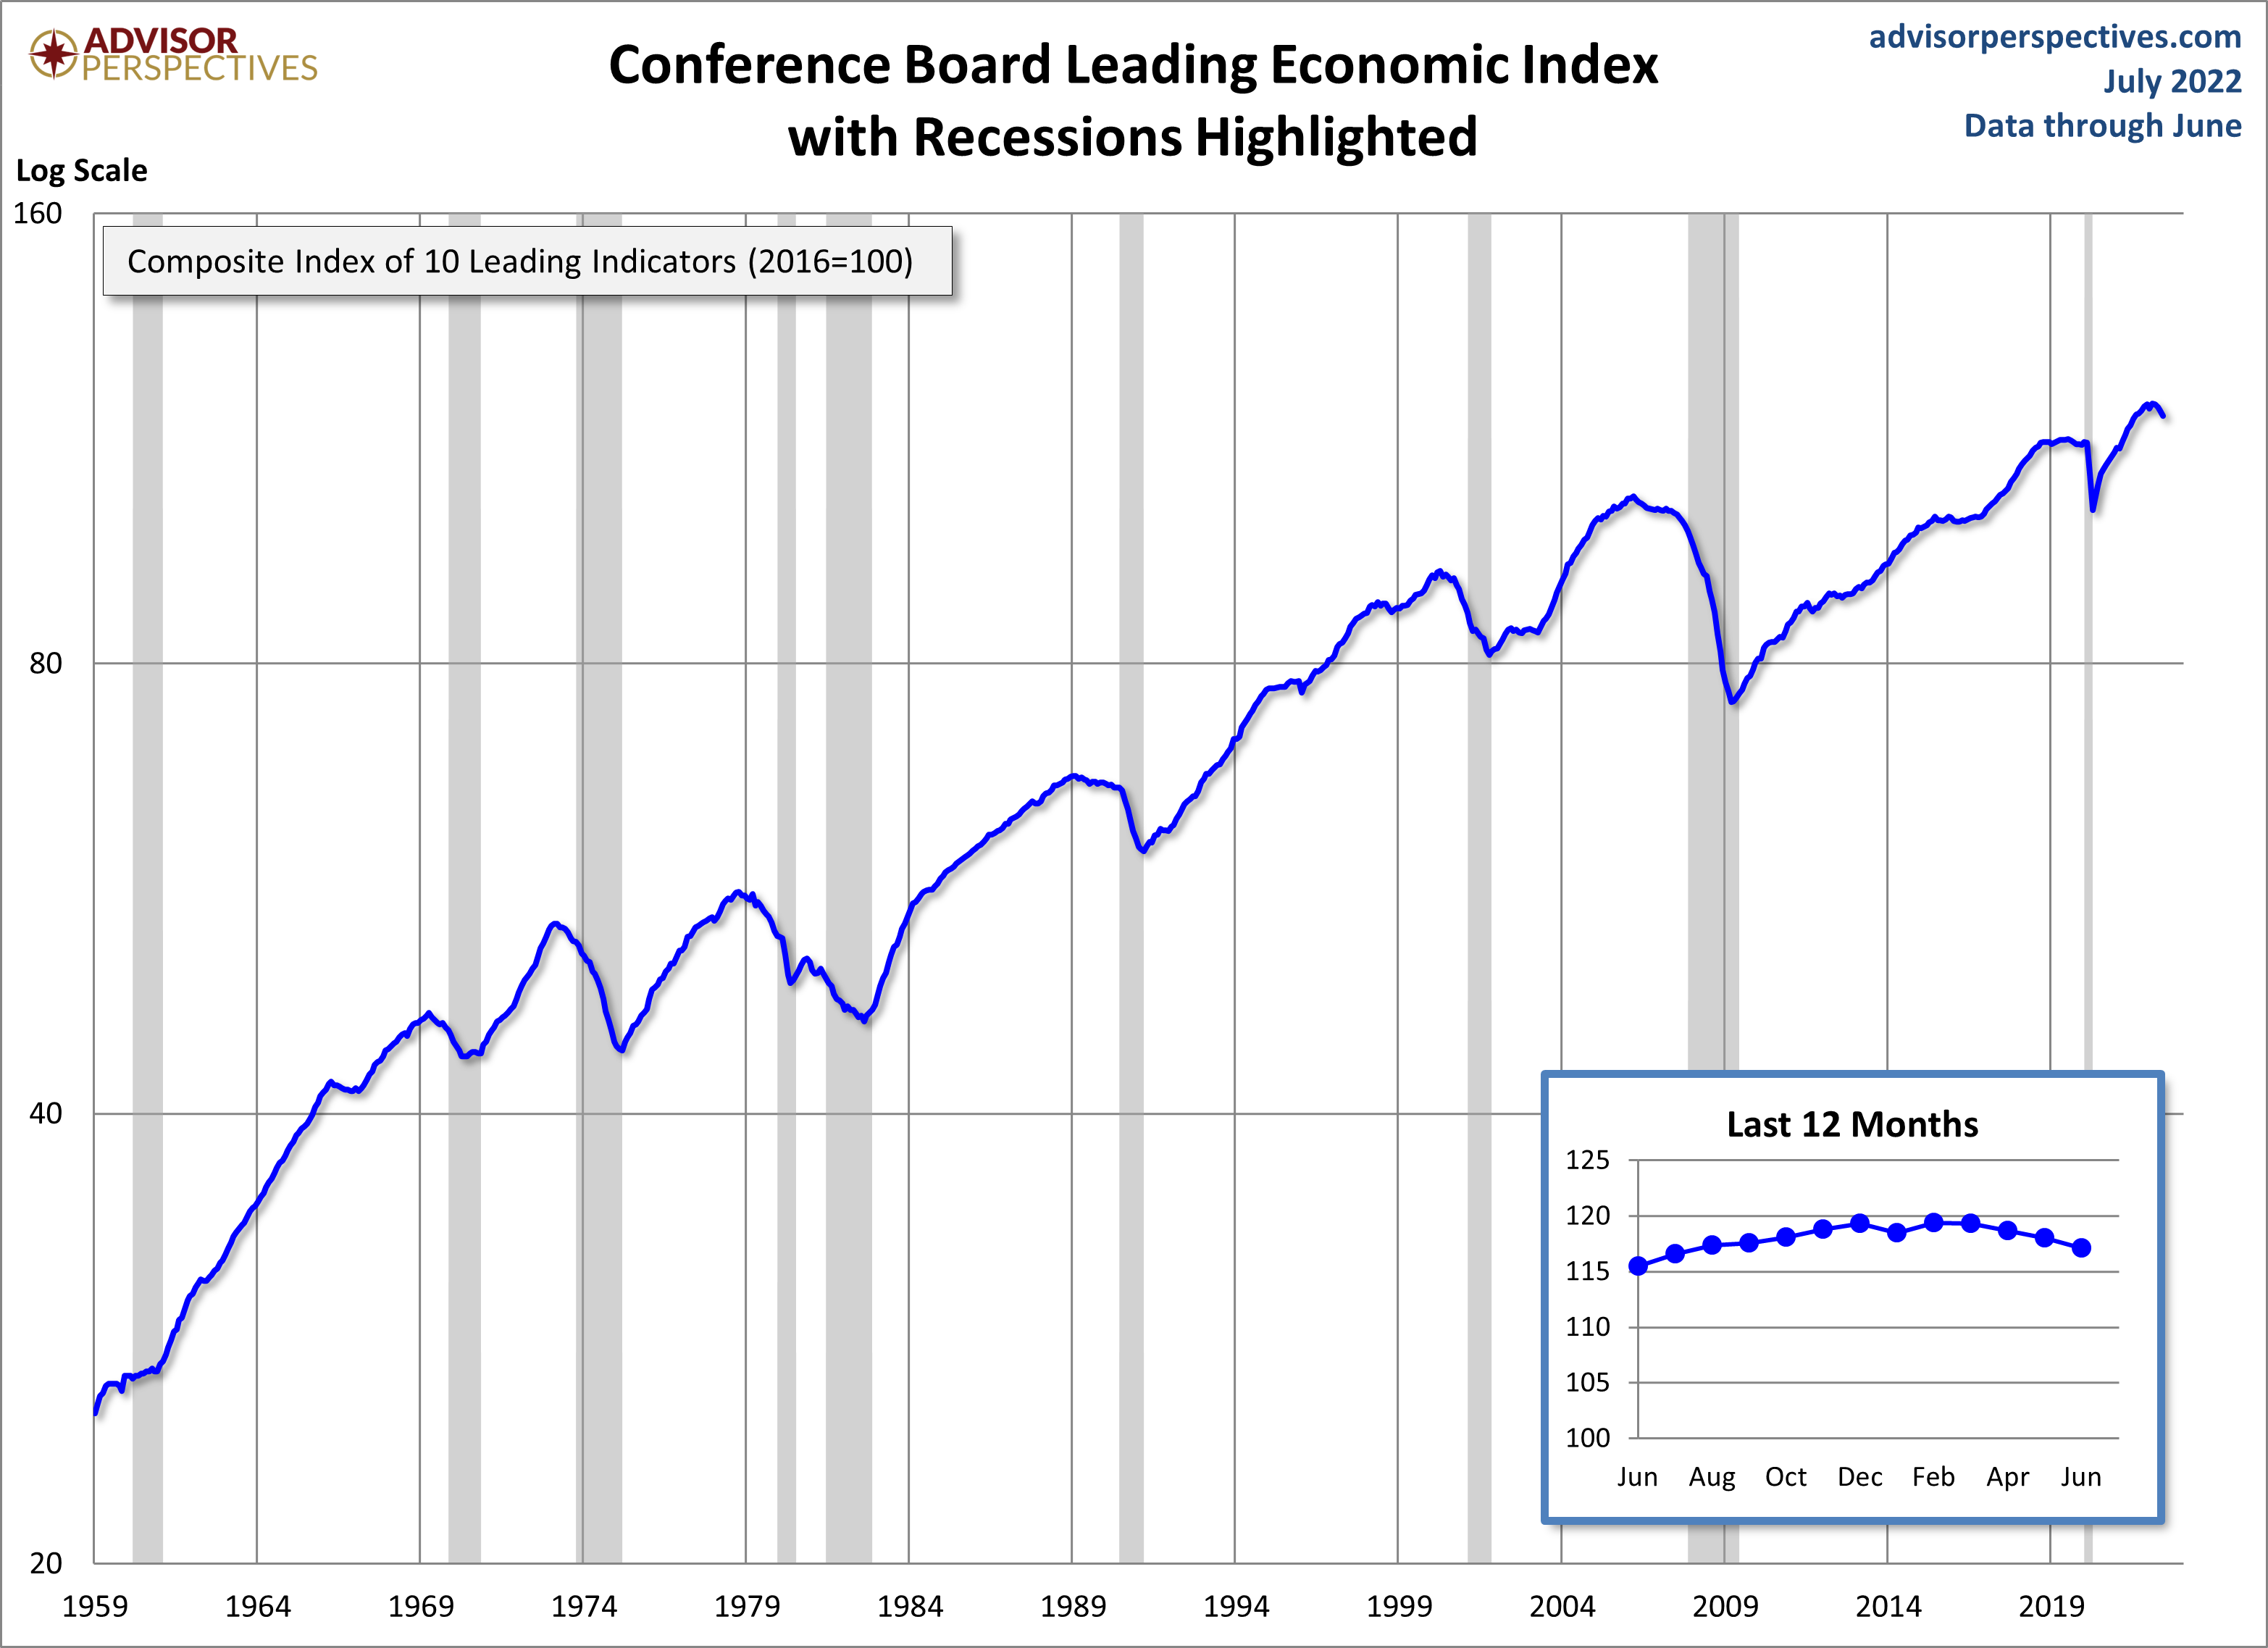
Here is a log-scale chart of the LEI series with documented recessions as identified by the NBER. The use of a log scale gives us a better sense of the relative sizes of peaks and troughs than a more conventional linear scale.
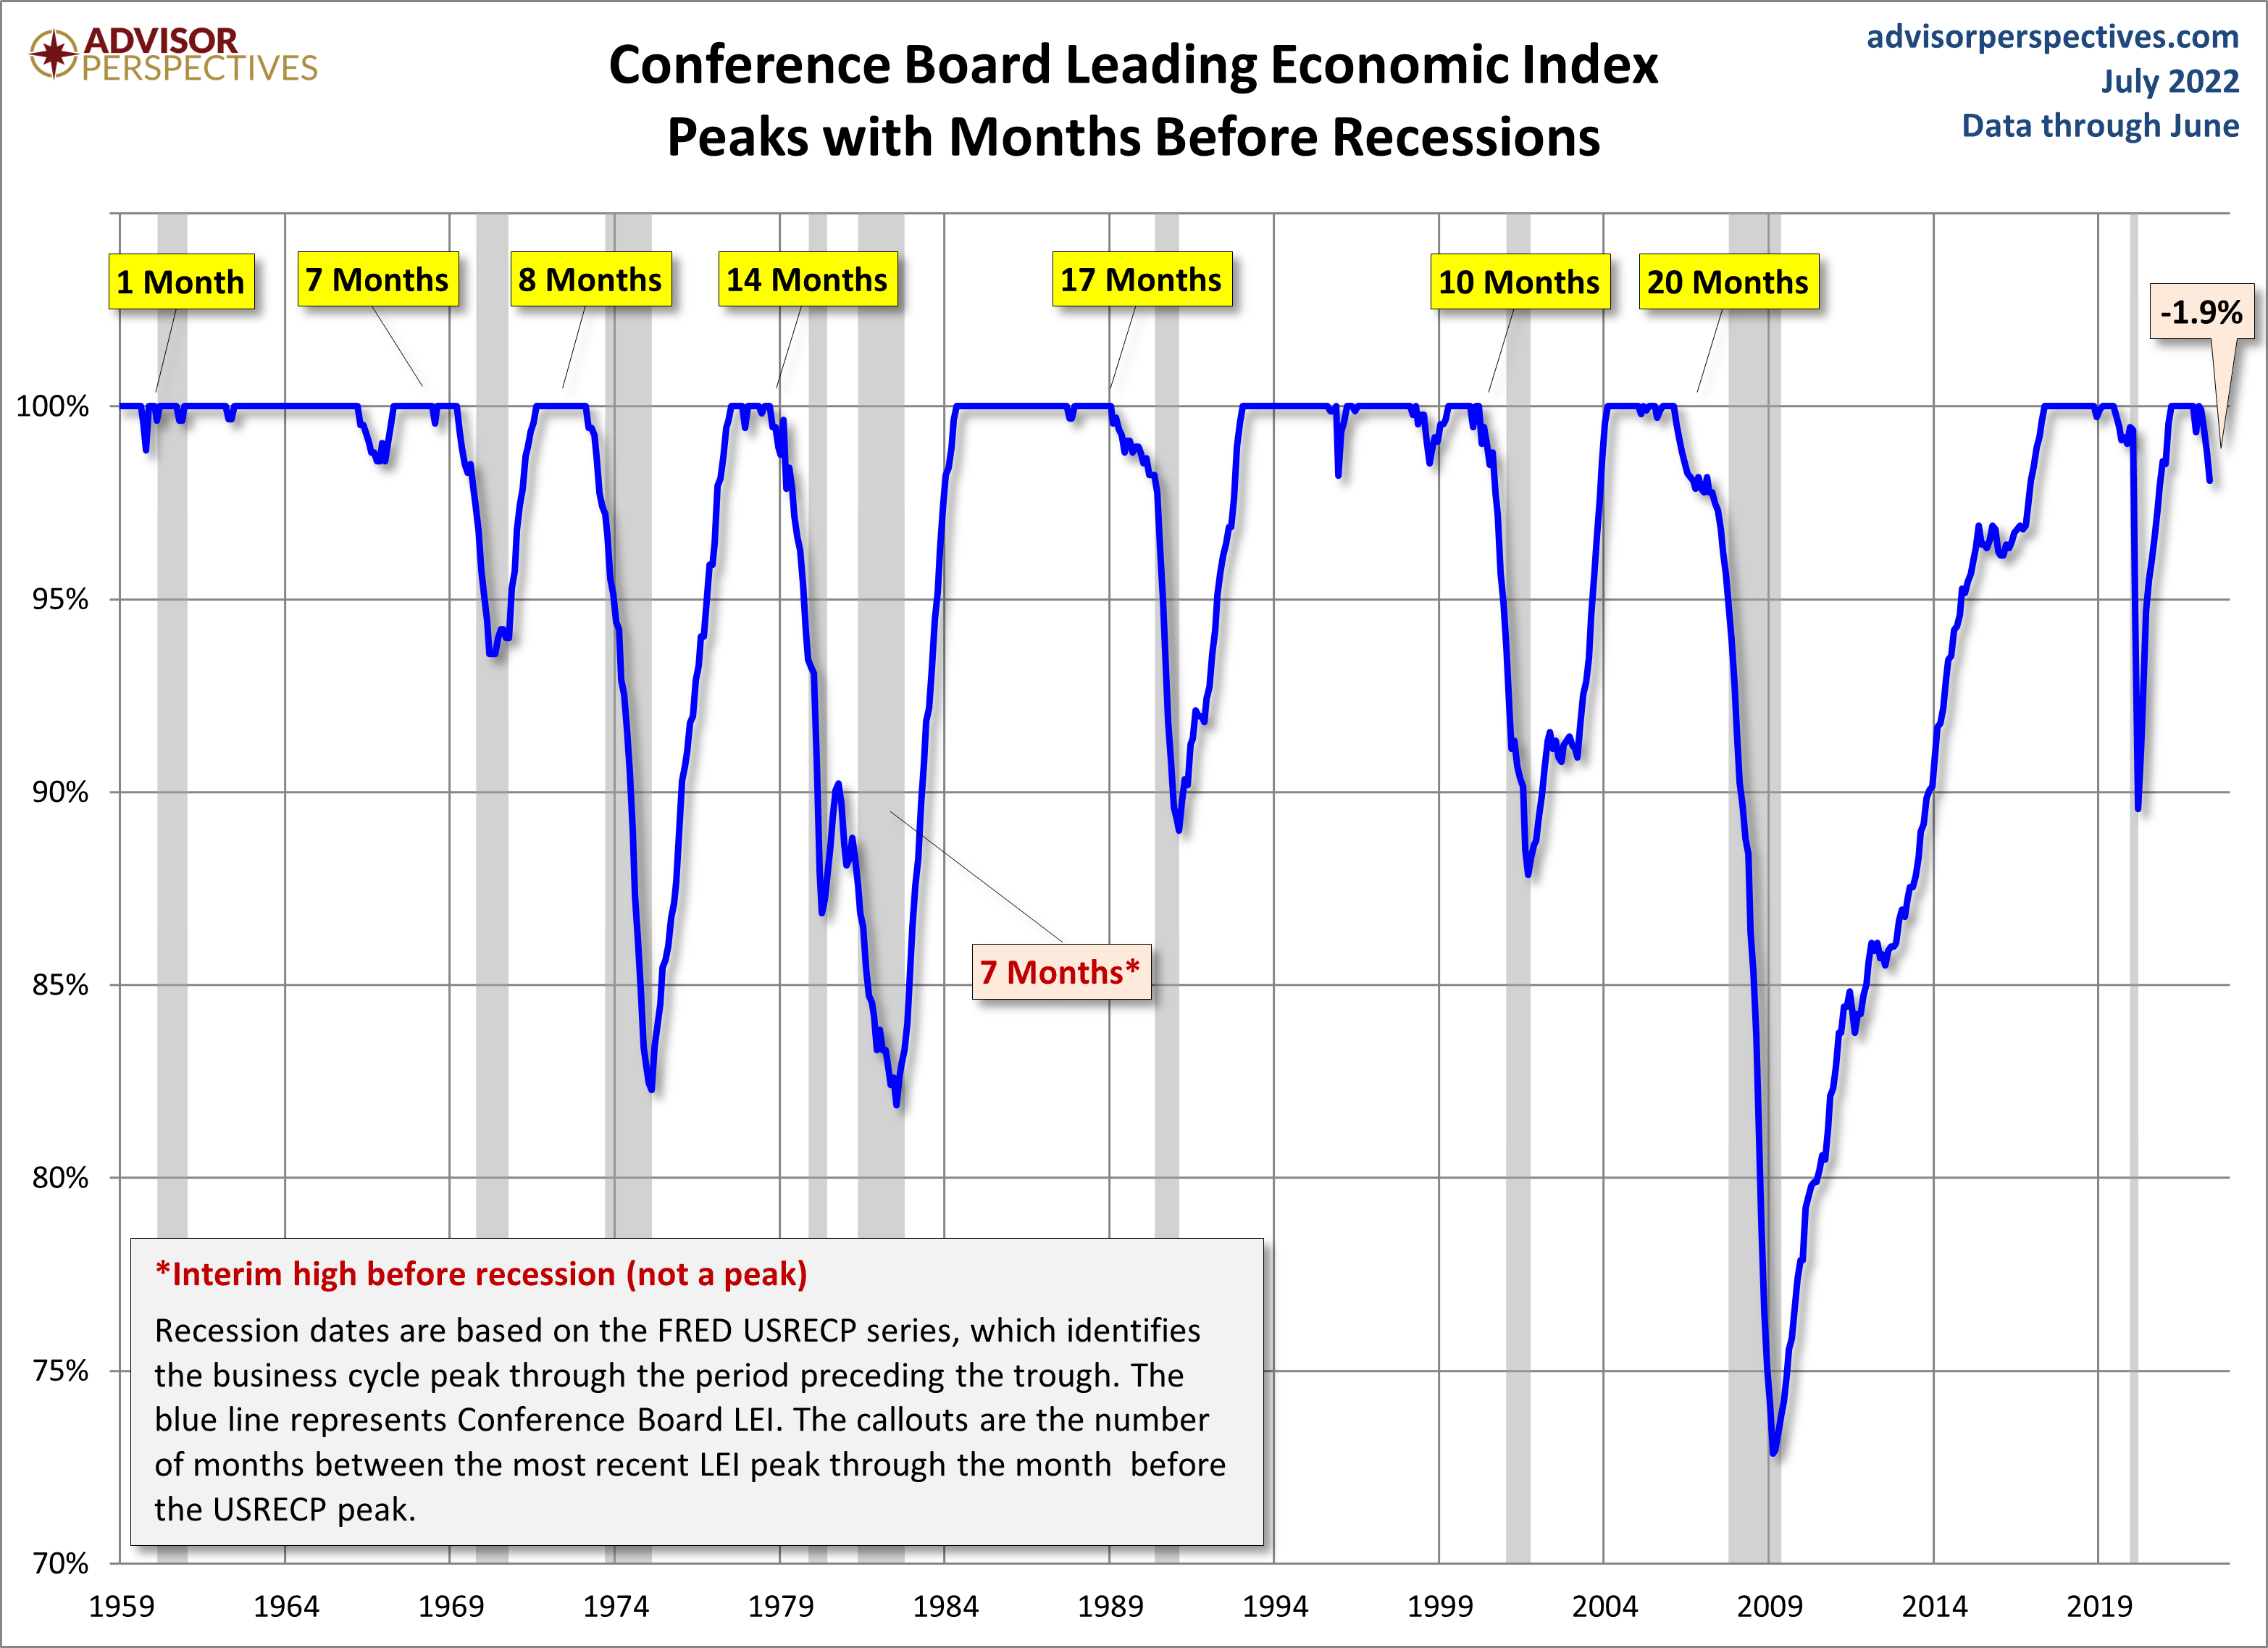
For a better understanding of the relationship between the LEI and recessions, the next chart shows the percentage-off the previous peak for the index and the number of months between the previous peak and official recessions.
LEI and Its Six-Month Smoothed Rate of Change
Based on suggestions from Neile Wolfe of Wells Fargo Advisors and Dwaine Van Vuuren of RecessionAlert, we can tighten the recession lead times for this indicator by plotting a smoothed six-month rate of change to further enhance our use of the Conference Board's LEI as a gauge of recession risk.
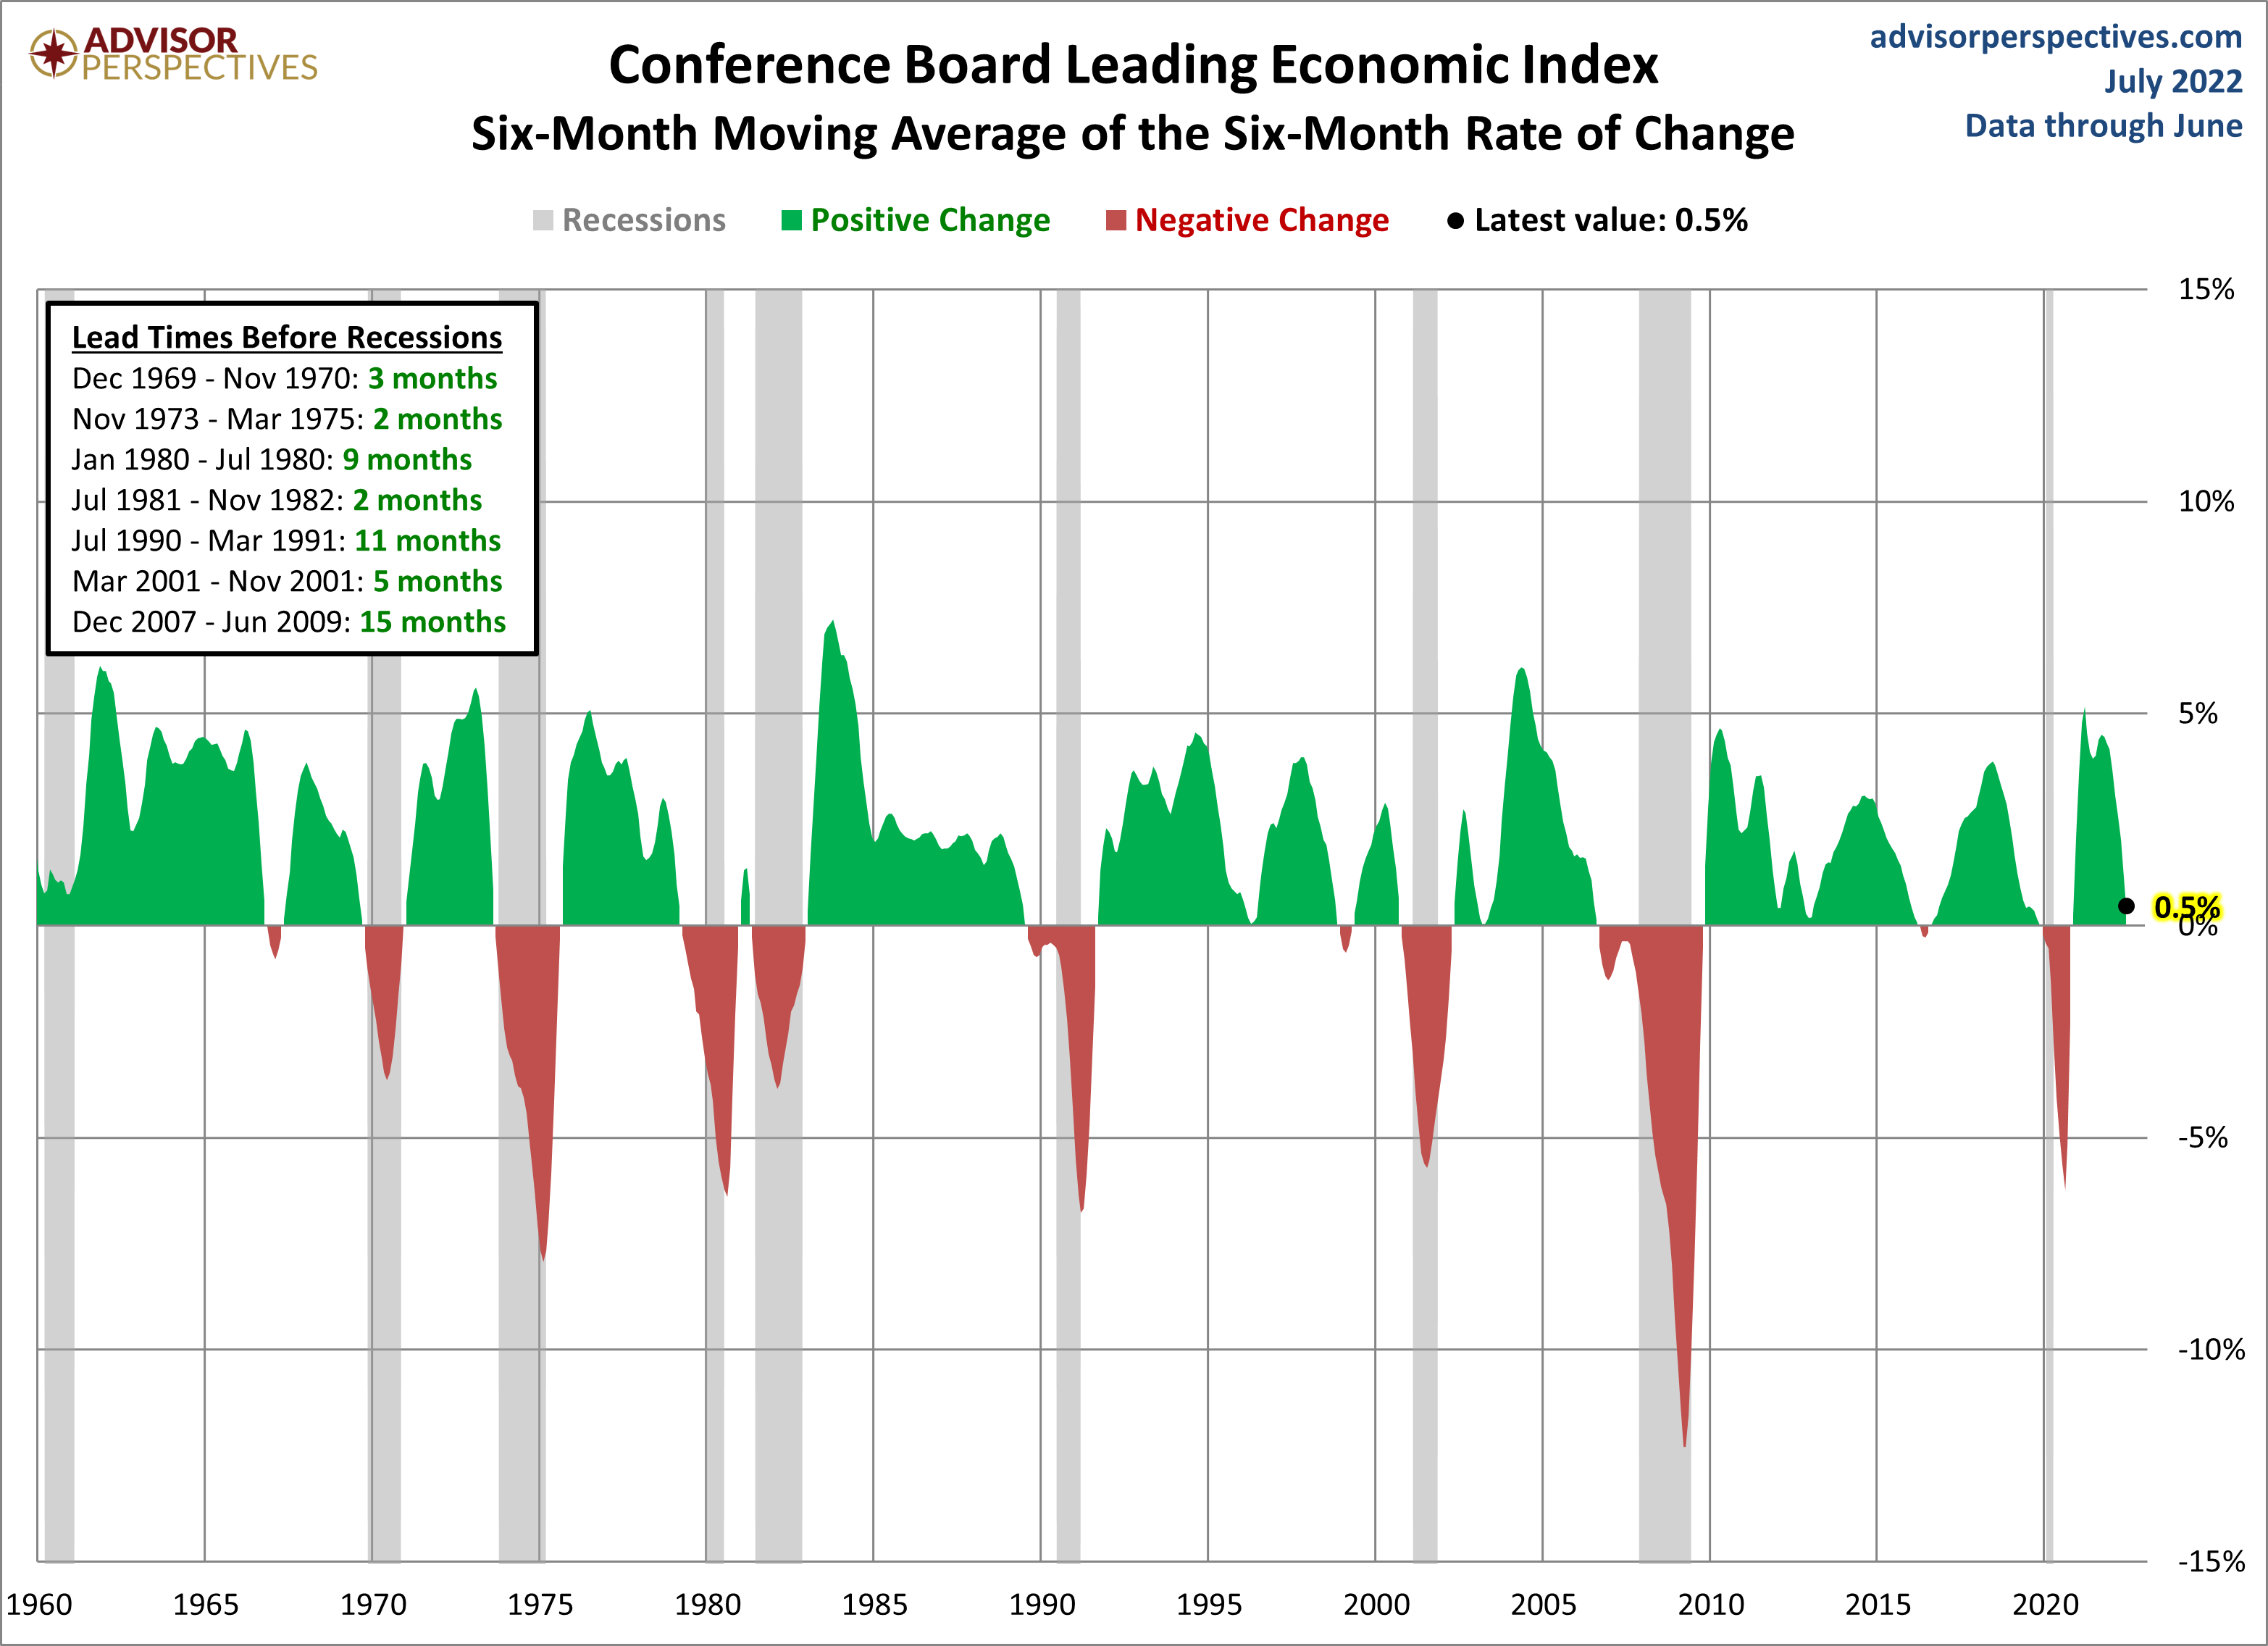
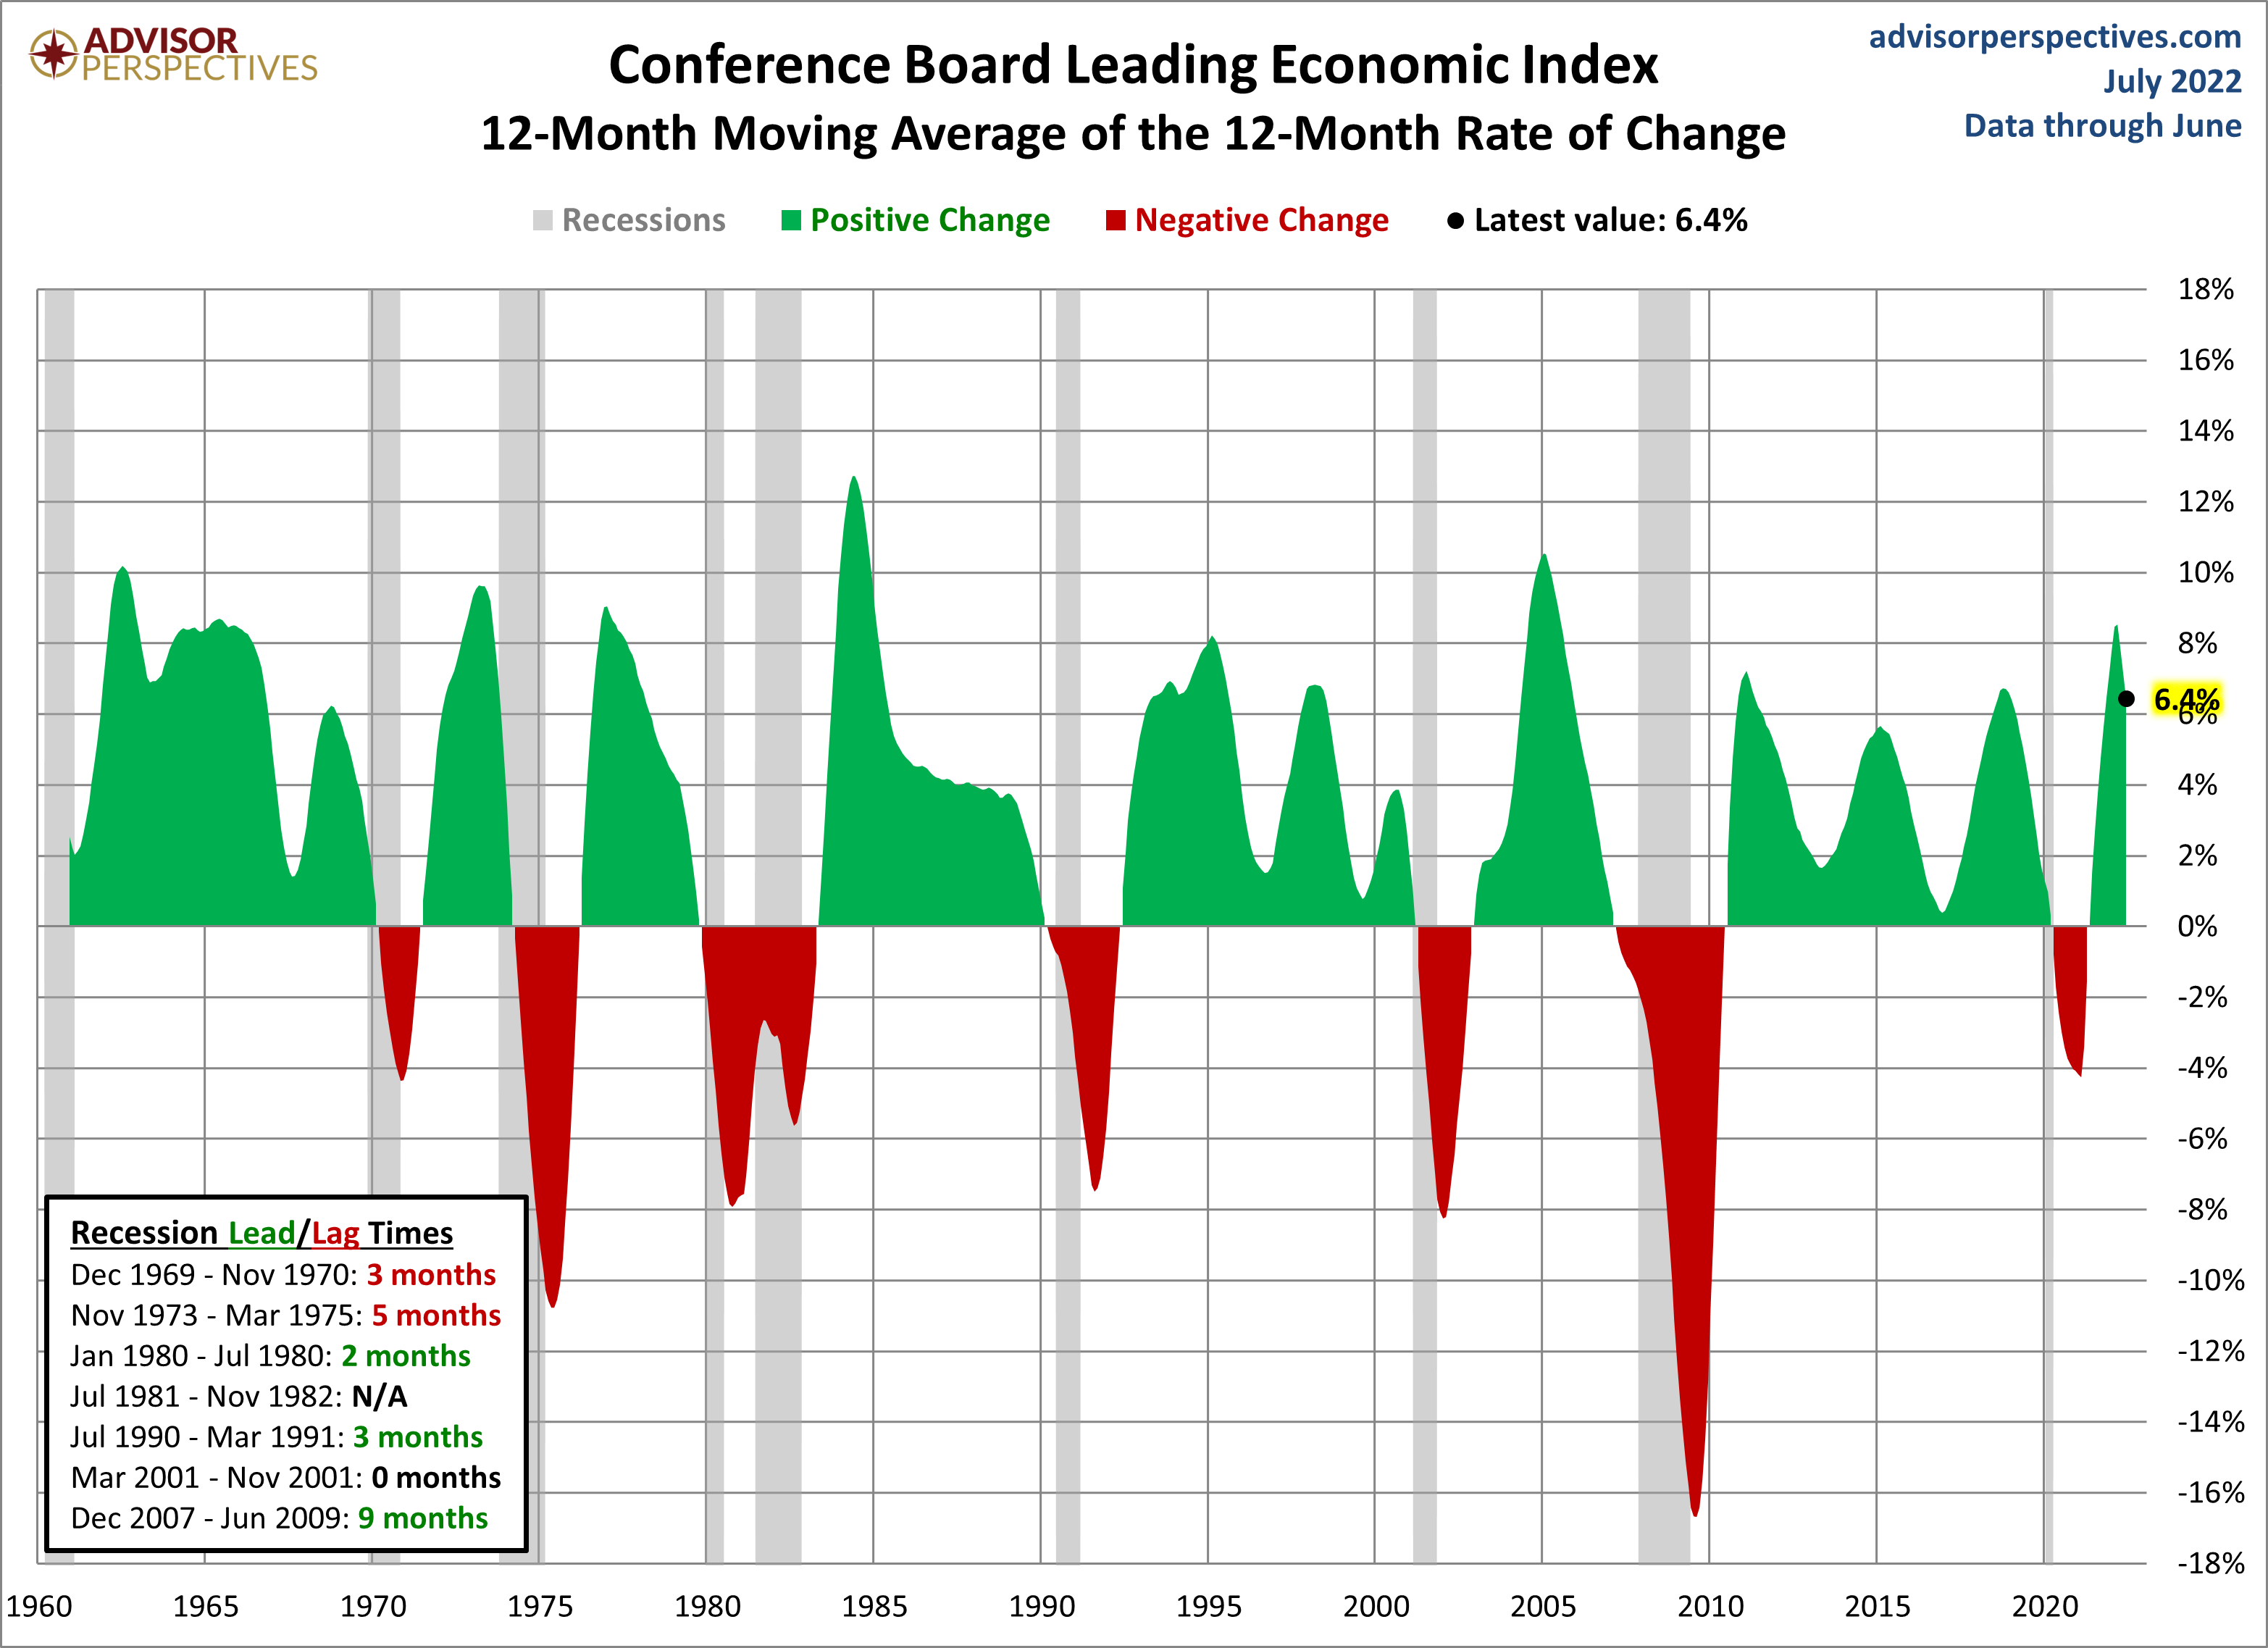
As we can see, the LEI has historically dropped below its six-month moving average anywhere between 2 to 15 months before a recession. Here is a twelve-month smoothed out version, which further eliminates the whipsaws:
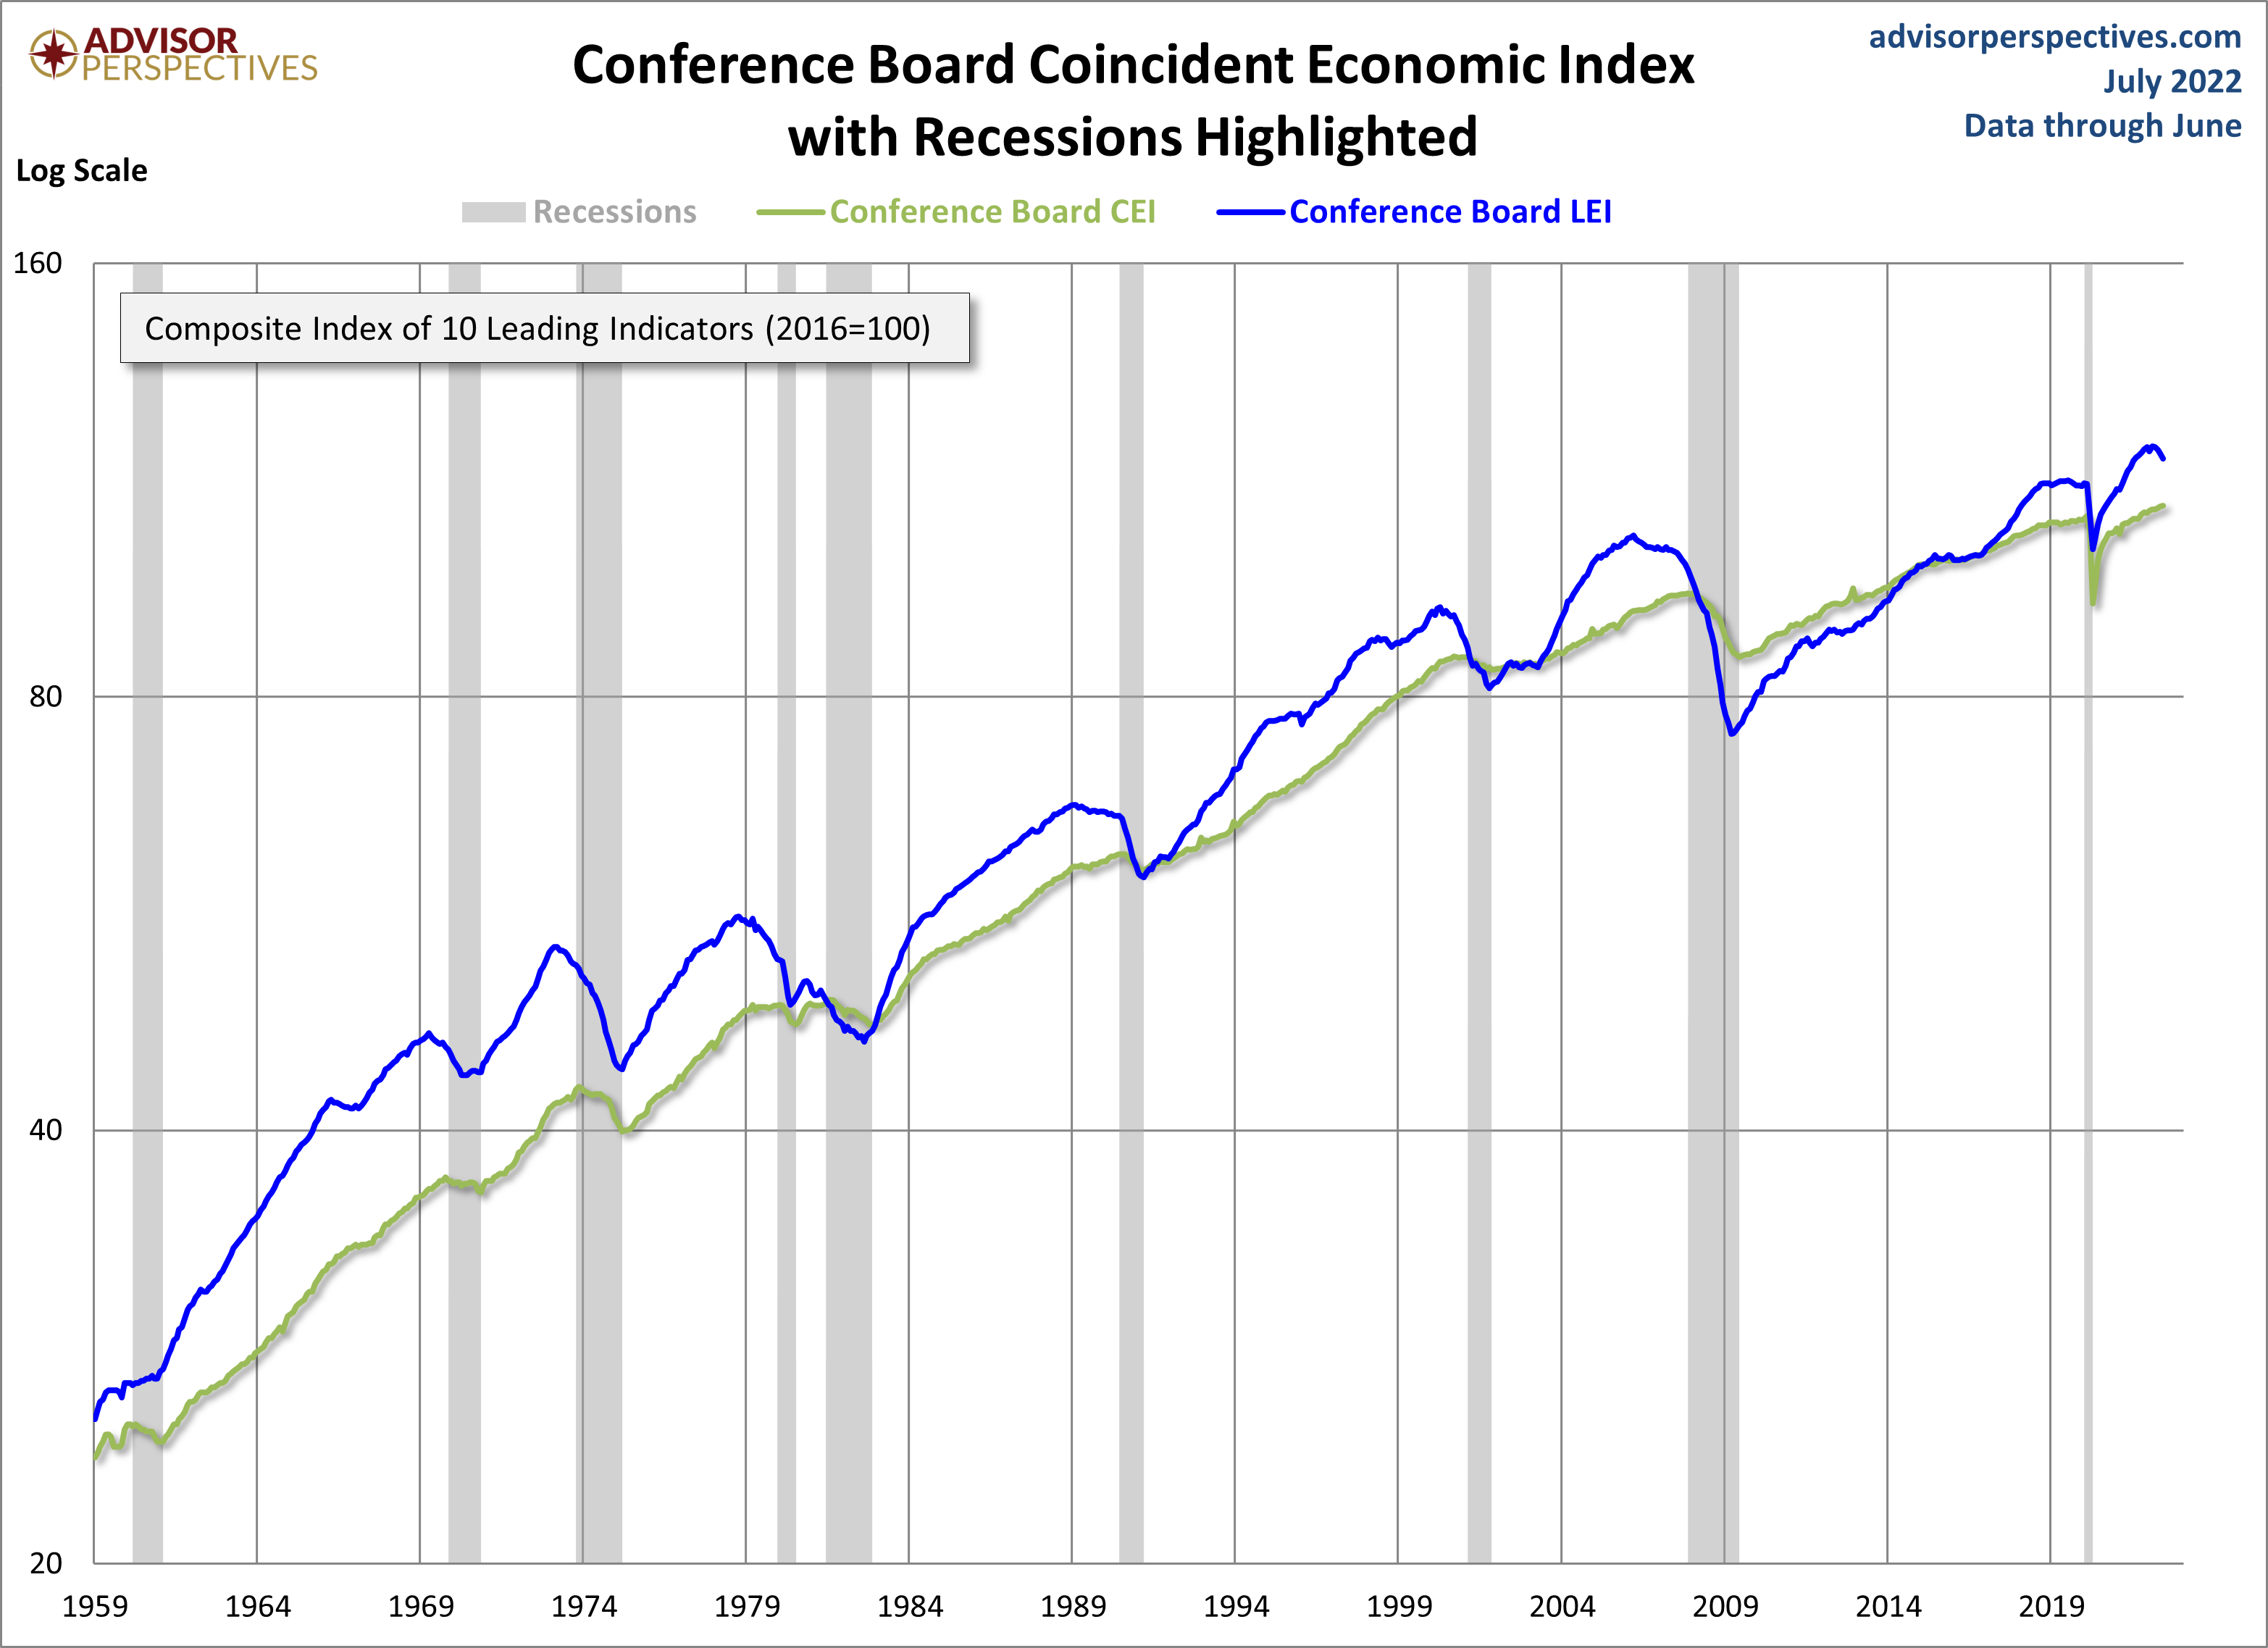
The Conference Board also includes its Coincident Economic Index (CEI) in each release. It measures current economic activity and is made up of four components: nonagricultural payroll, personal income less transfer payments, manufacturing and trade sales, and industrial production. Based on observations, when the LEI begins to decline, the CEI is still rising. Here's a chart including both the CEI and LEI.
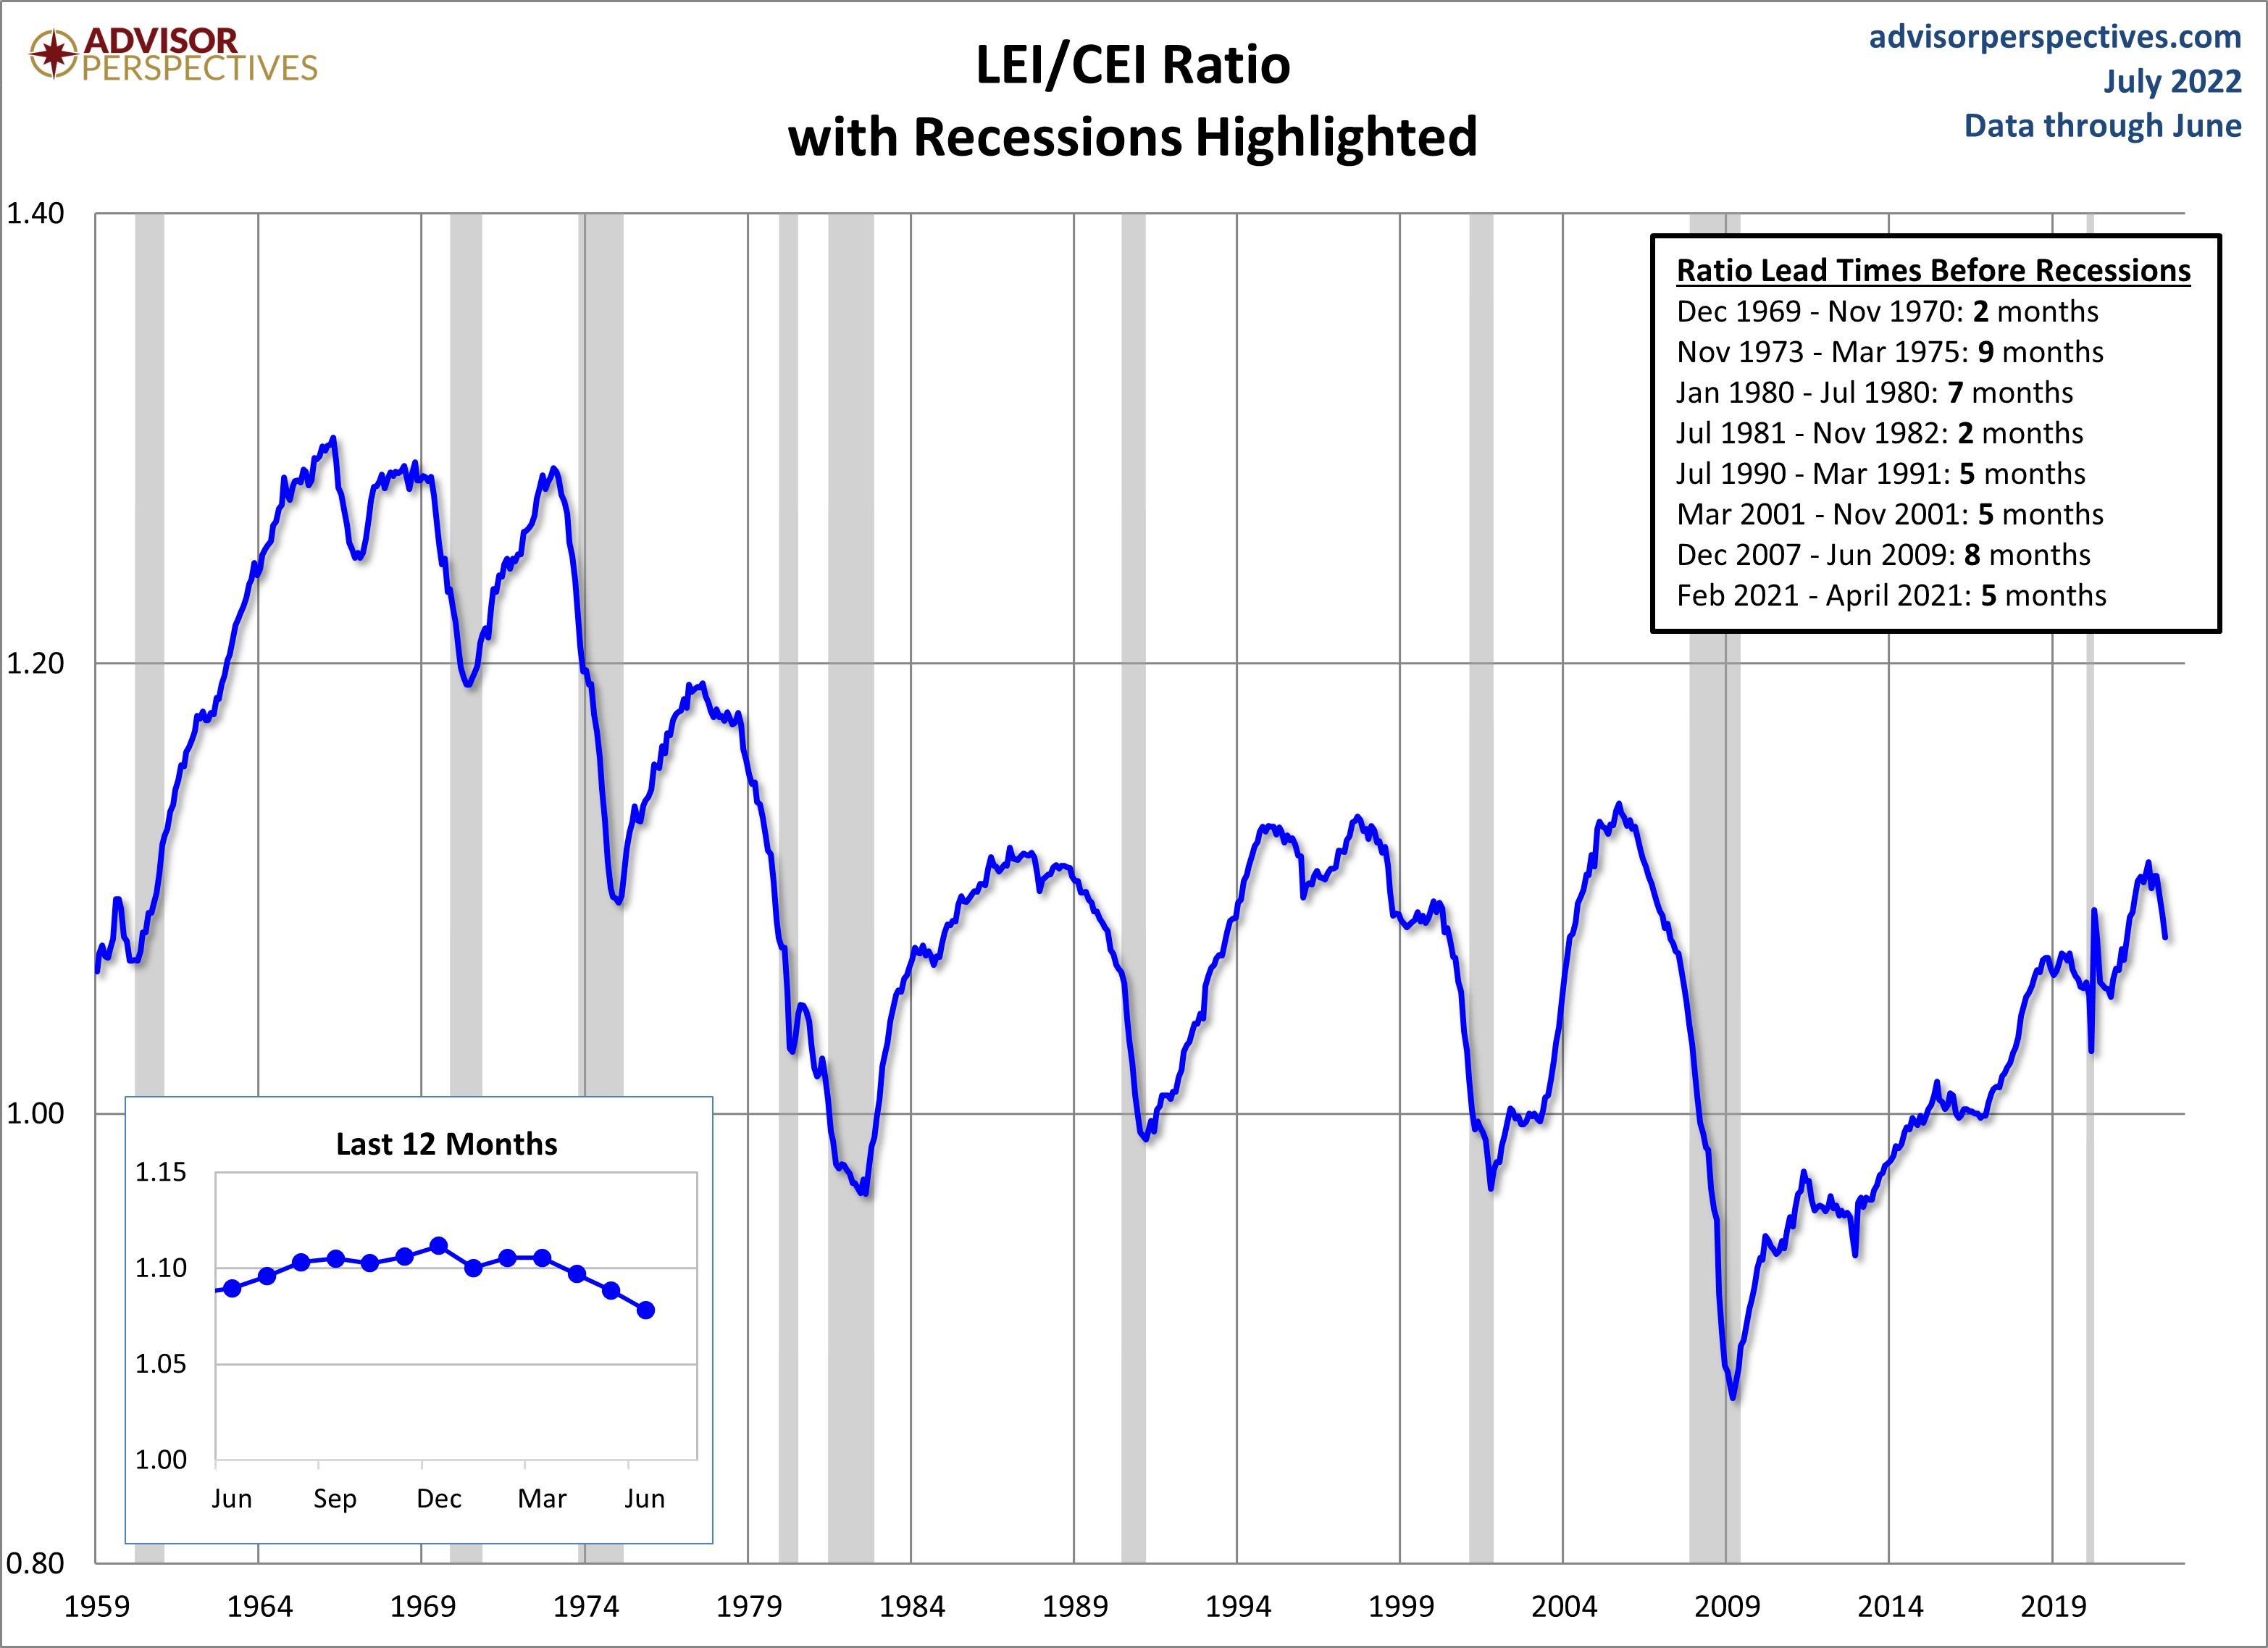
Here is a chart of the LEI/CEI ratio, which perhaps has been a leading indicator of recessions. We count the lead time as the number of months that the ratio has been declining prior to a recession. There have been times where the ratio has been in decline for several months without a recession.
More By This Author:
Weekly Unemployment Claims: Up 7K - Thursday, July 21Philly Fed Mfg Index: Activity Declines In July
Cryptocurrencies Through Wednesday, July 20


Comments
Log in or sign up to join the conversation.