CB LEI: Fall In April
The latest Conference Board Leading Economic Index (LEI) for April was down 0.3% from the March final figure of 119.2.
The Conference Board Leading Economic Index® (LEI)for theU.S. decreased by 0.3 percent in April to 119.2 (2016 = 100), following a 0.1 percent increase in March. The LEI is now up 0.9 percent over the six-month period from October 2021 to April 2022.
“The US LEI declined in April largely due to weak consumer expectations and a drop in residential building permits,” said Ataman Ozyildirim, Senior Director of Economic Research at The Conference Board. “Overall, the US LEI was essentially flat in recent months which is in line with a moderate growth outlook in the near-term. A range of downside risks—including inflation, rising interest rates, supply chain disruptions, and pandemic-related shutdowns, particularly in China—continue to weigh on the outlook. Nevertheless, we project the US economy should resume expanding in Q2 following Q1’s contraction in real GDP. Despite downgrades to previous forecasts, The Conference Board still projects 2.3 percent year-over-year US GDP growth in 2022.” More
Here is a log-scale chart of the LEI series with documented recessions as identified by the NBER. The use of a log scale gives us a better sense of the relative sizes of peaks and troughs than a more conventional linear scale.

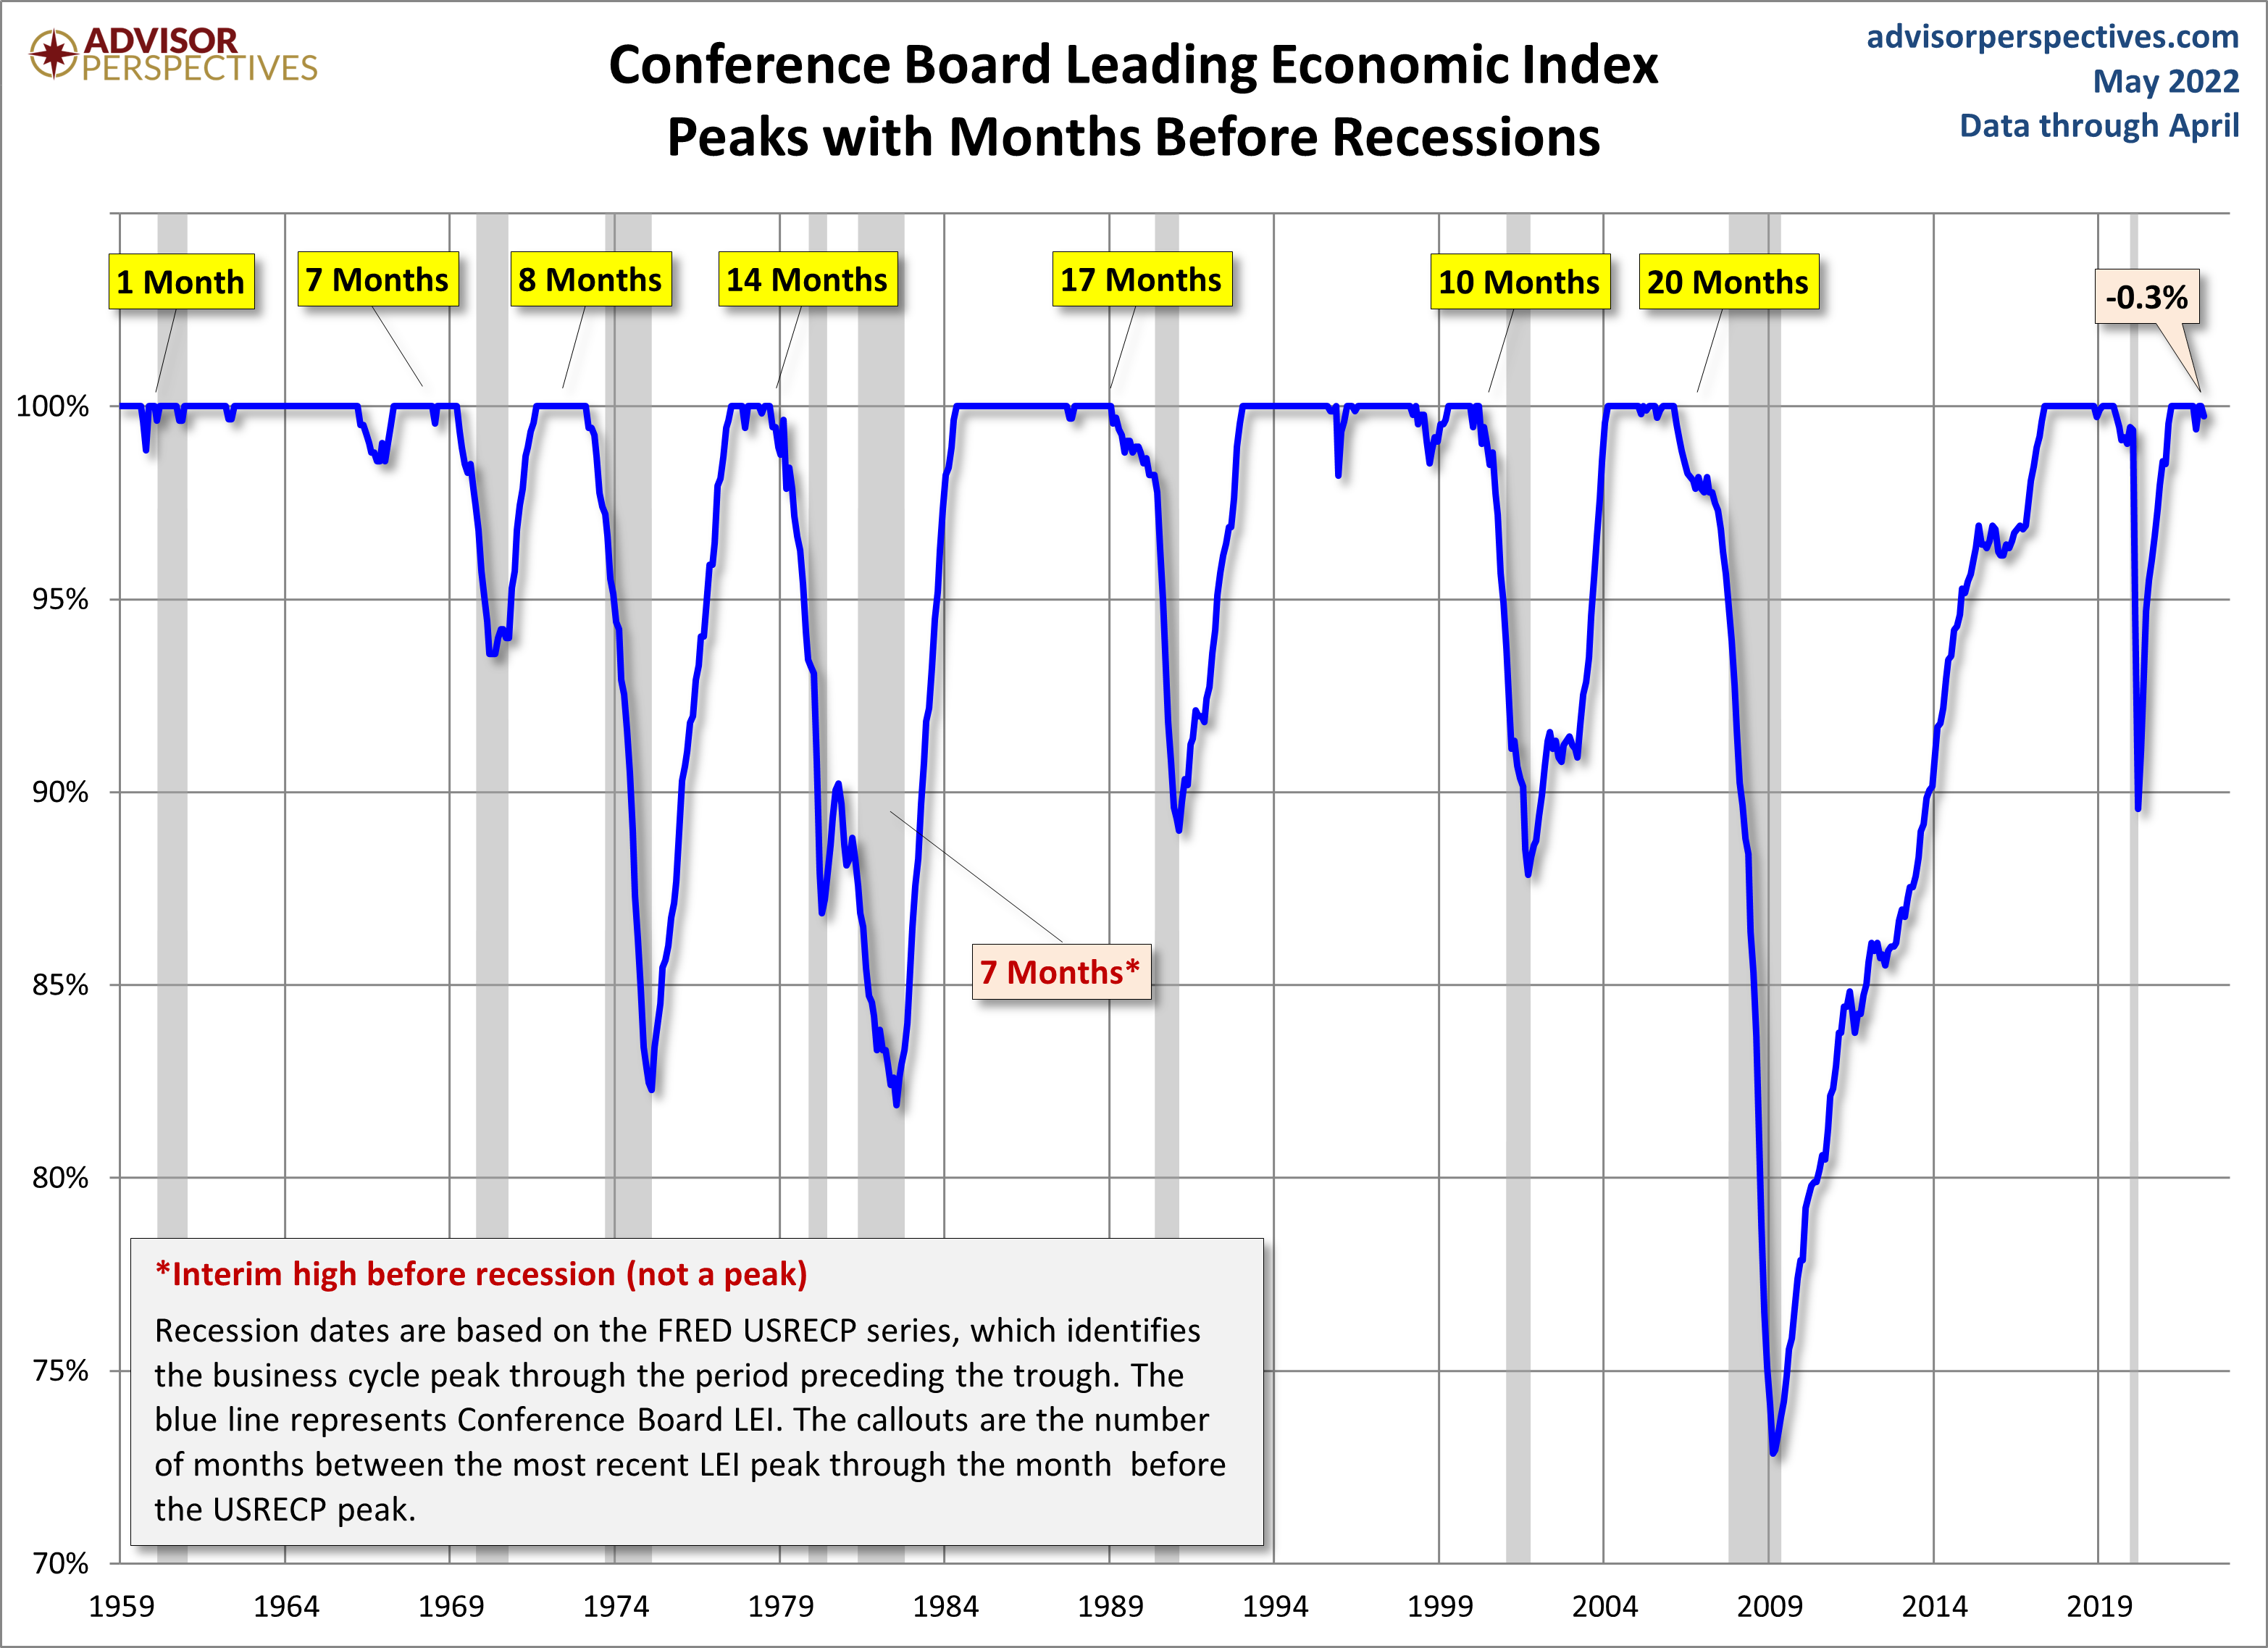
For a better understanding of the relationship between the LEI and recessions, the next chart shows the percentage-off the previous peak for the index and the number of months between the previous peak and official recessions.
LEI and Its Six-Month Smoothed Rate of Change
Based on suggestions from Neile Wolfe of Wells Fargo Advisors and Dwaine Van Vuuren of RecessionAlert, we can tighten the recession lead times for this indicator by plotting a smoothed six-month rate of change to further enhance our use of the Conference Board's LEI as a gauge of recession risk.
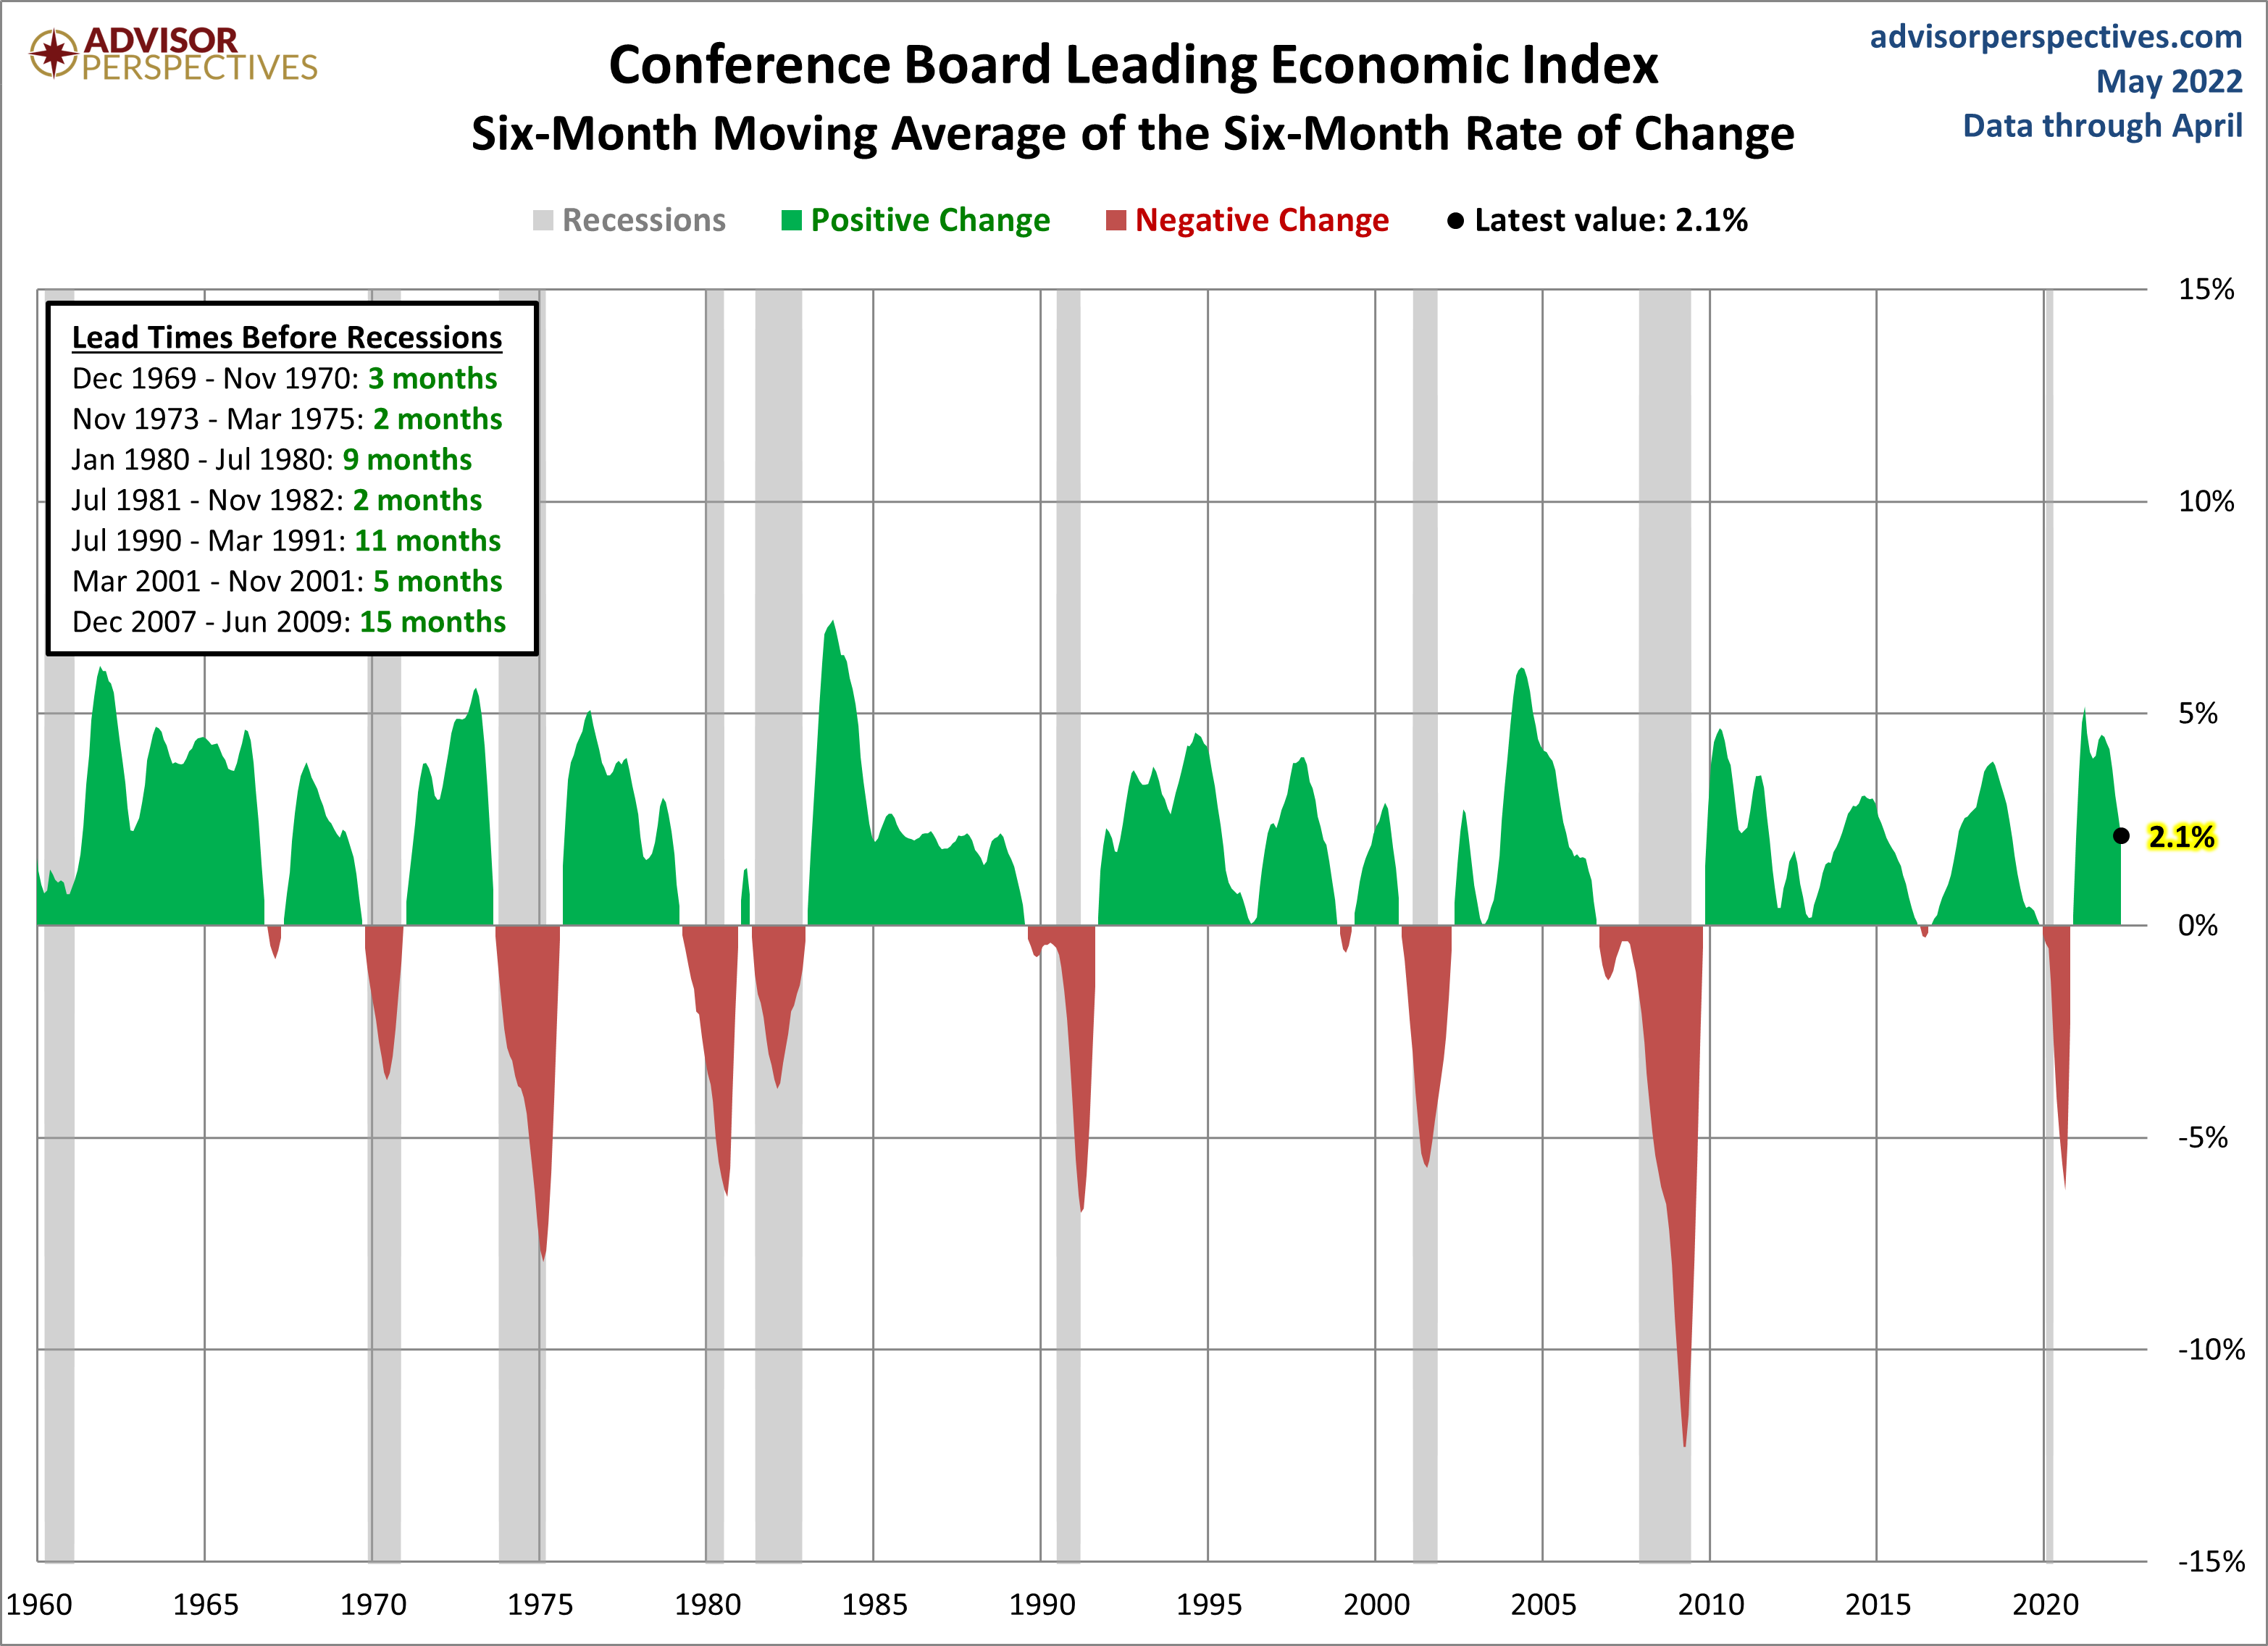
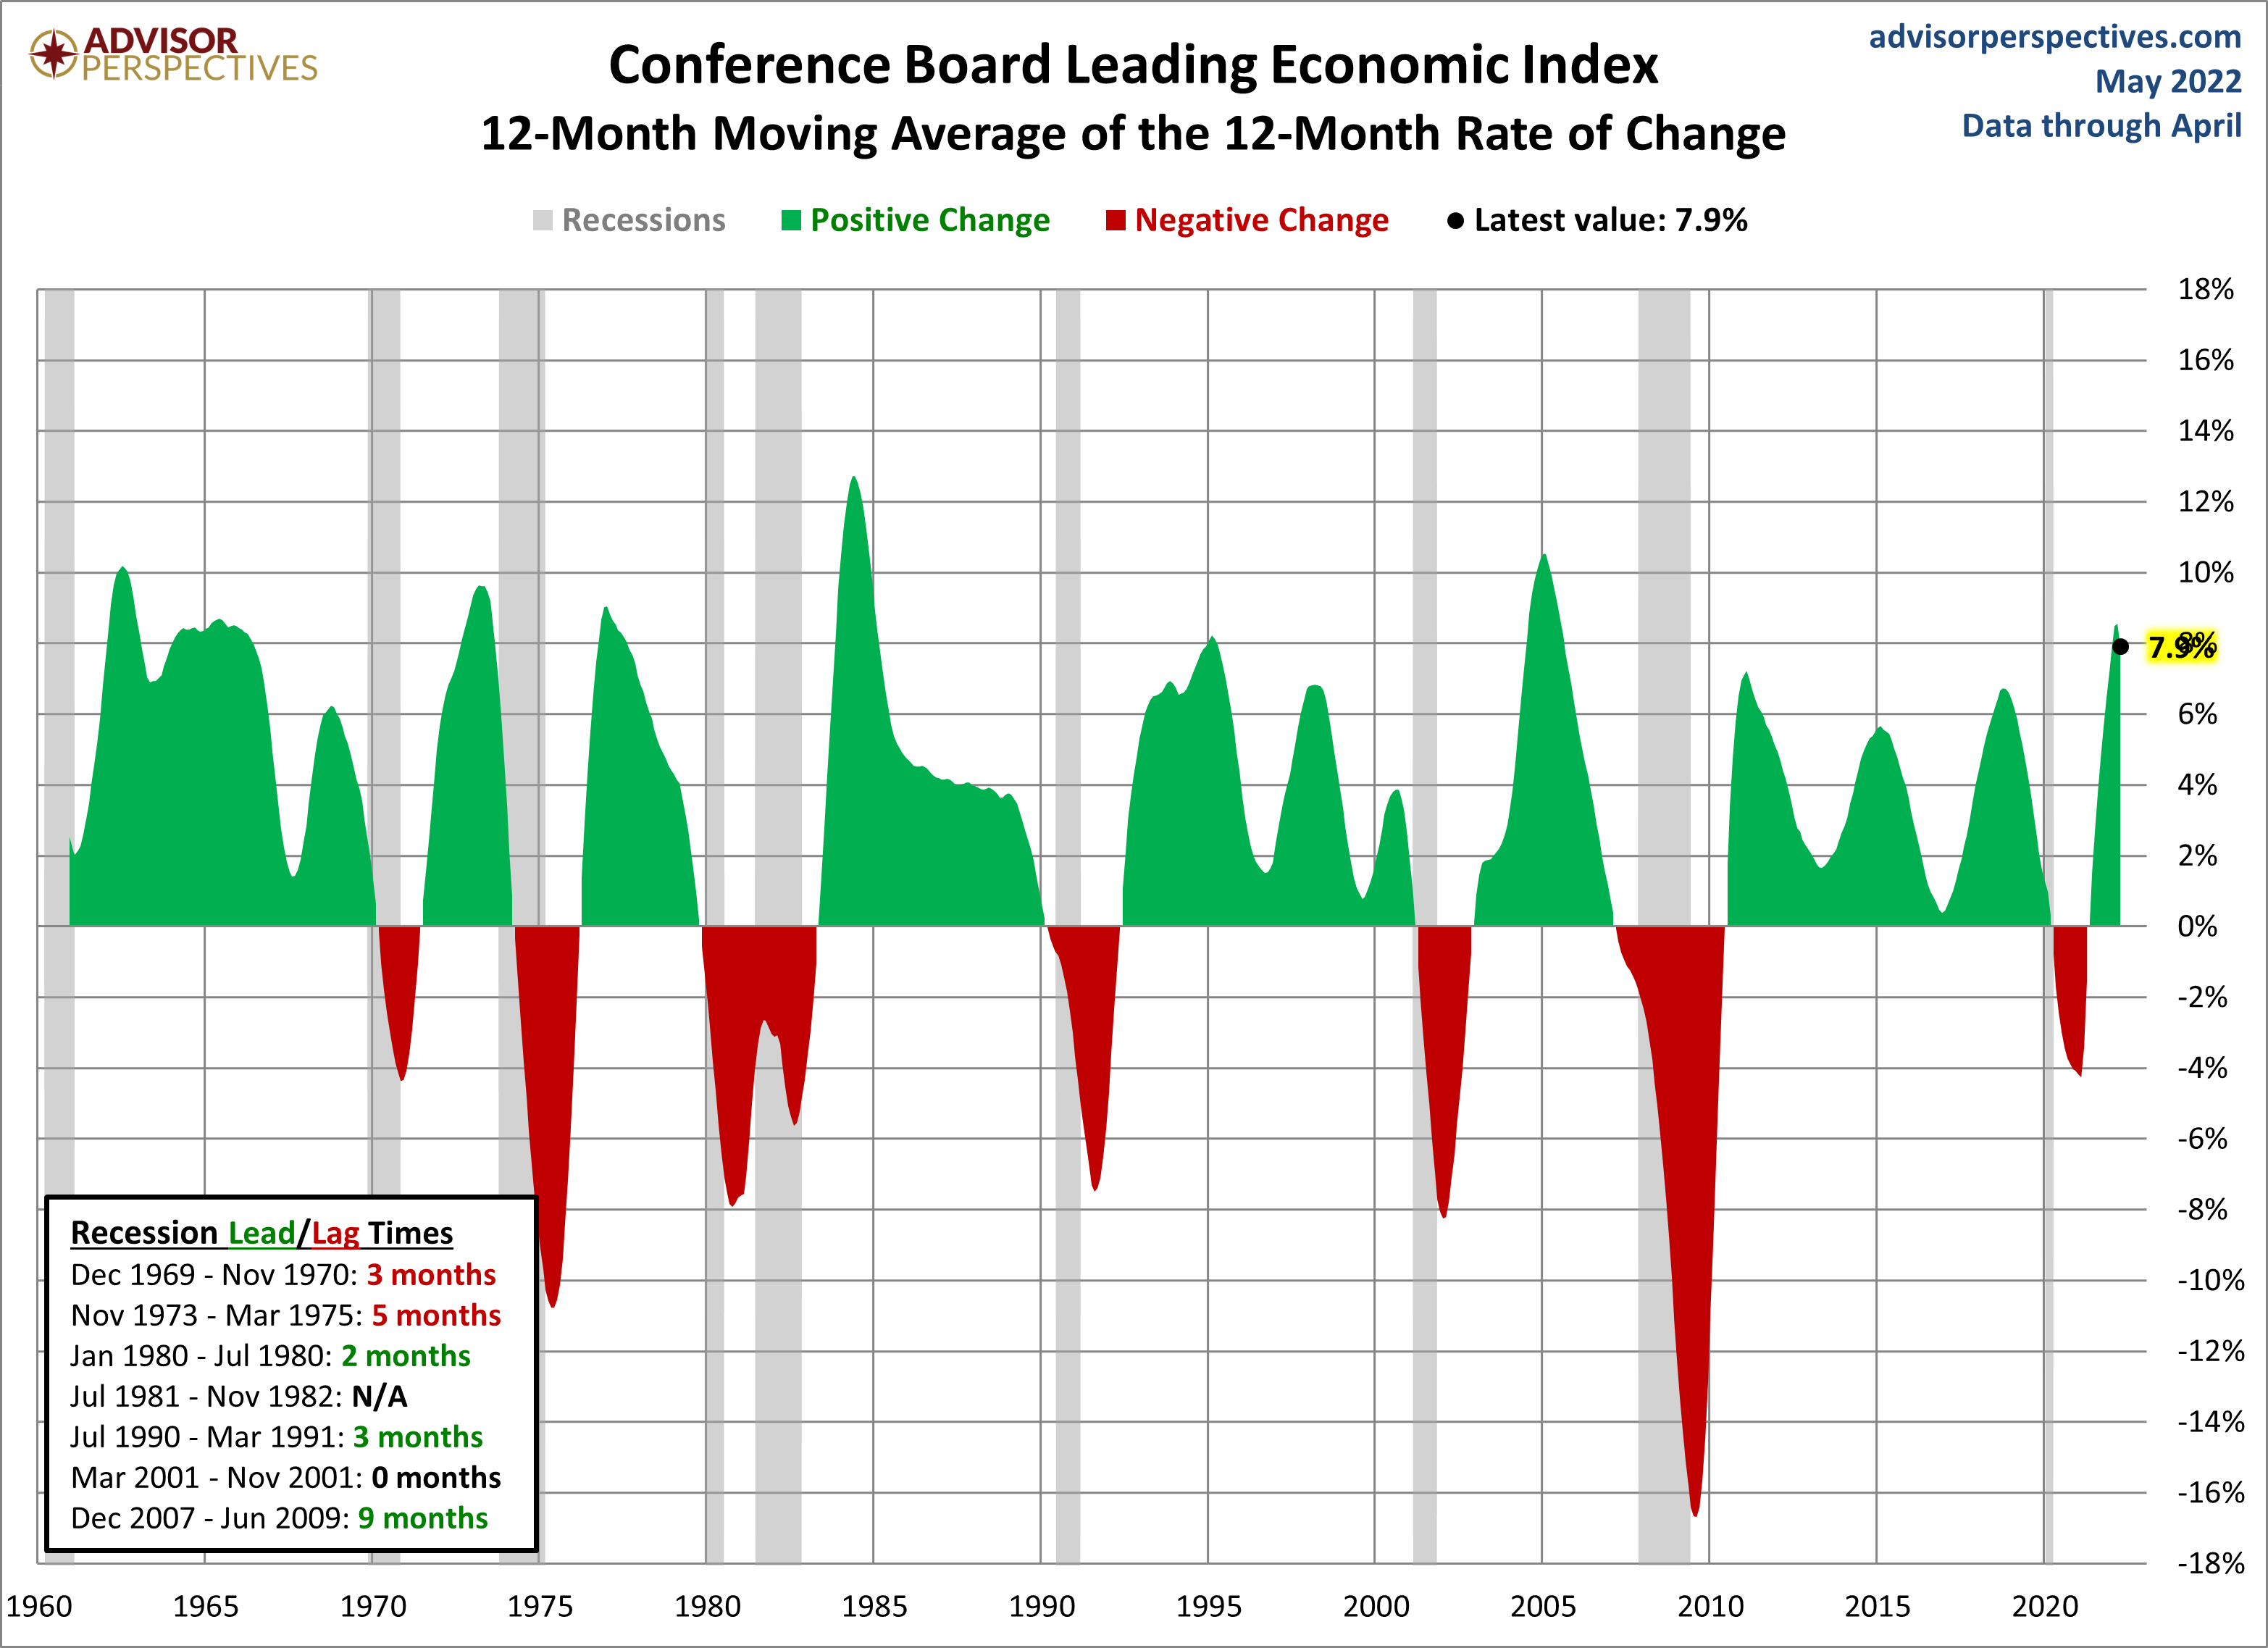
As we can see, the LEI has historically dropped below its six-month moving average anywhere between 2 to 15 months before a recession. Here is a twelve-month smoothed out version, which further eliminates the whipsaws:
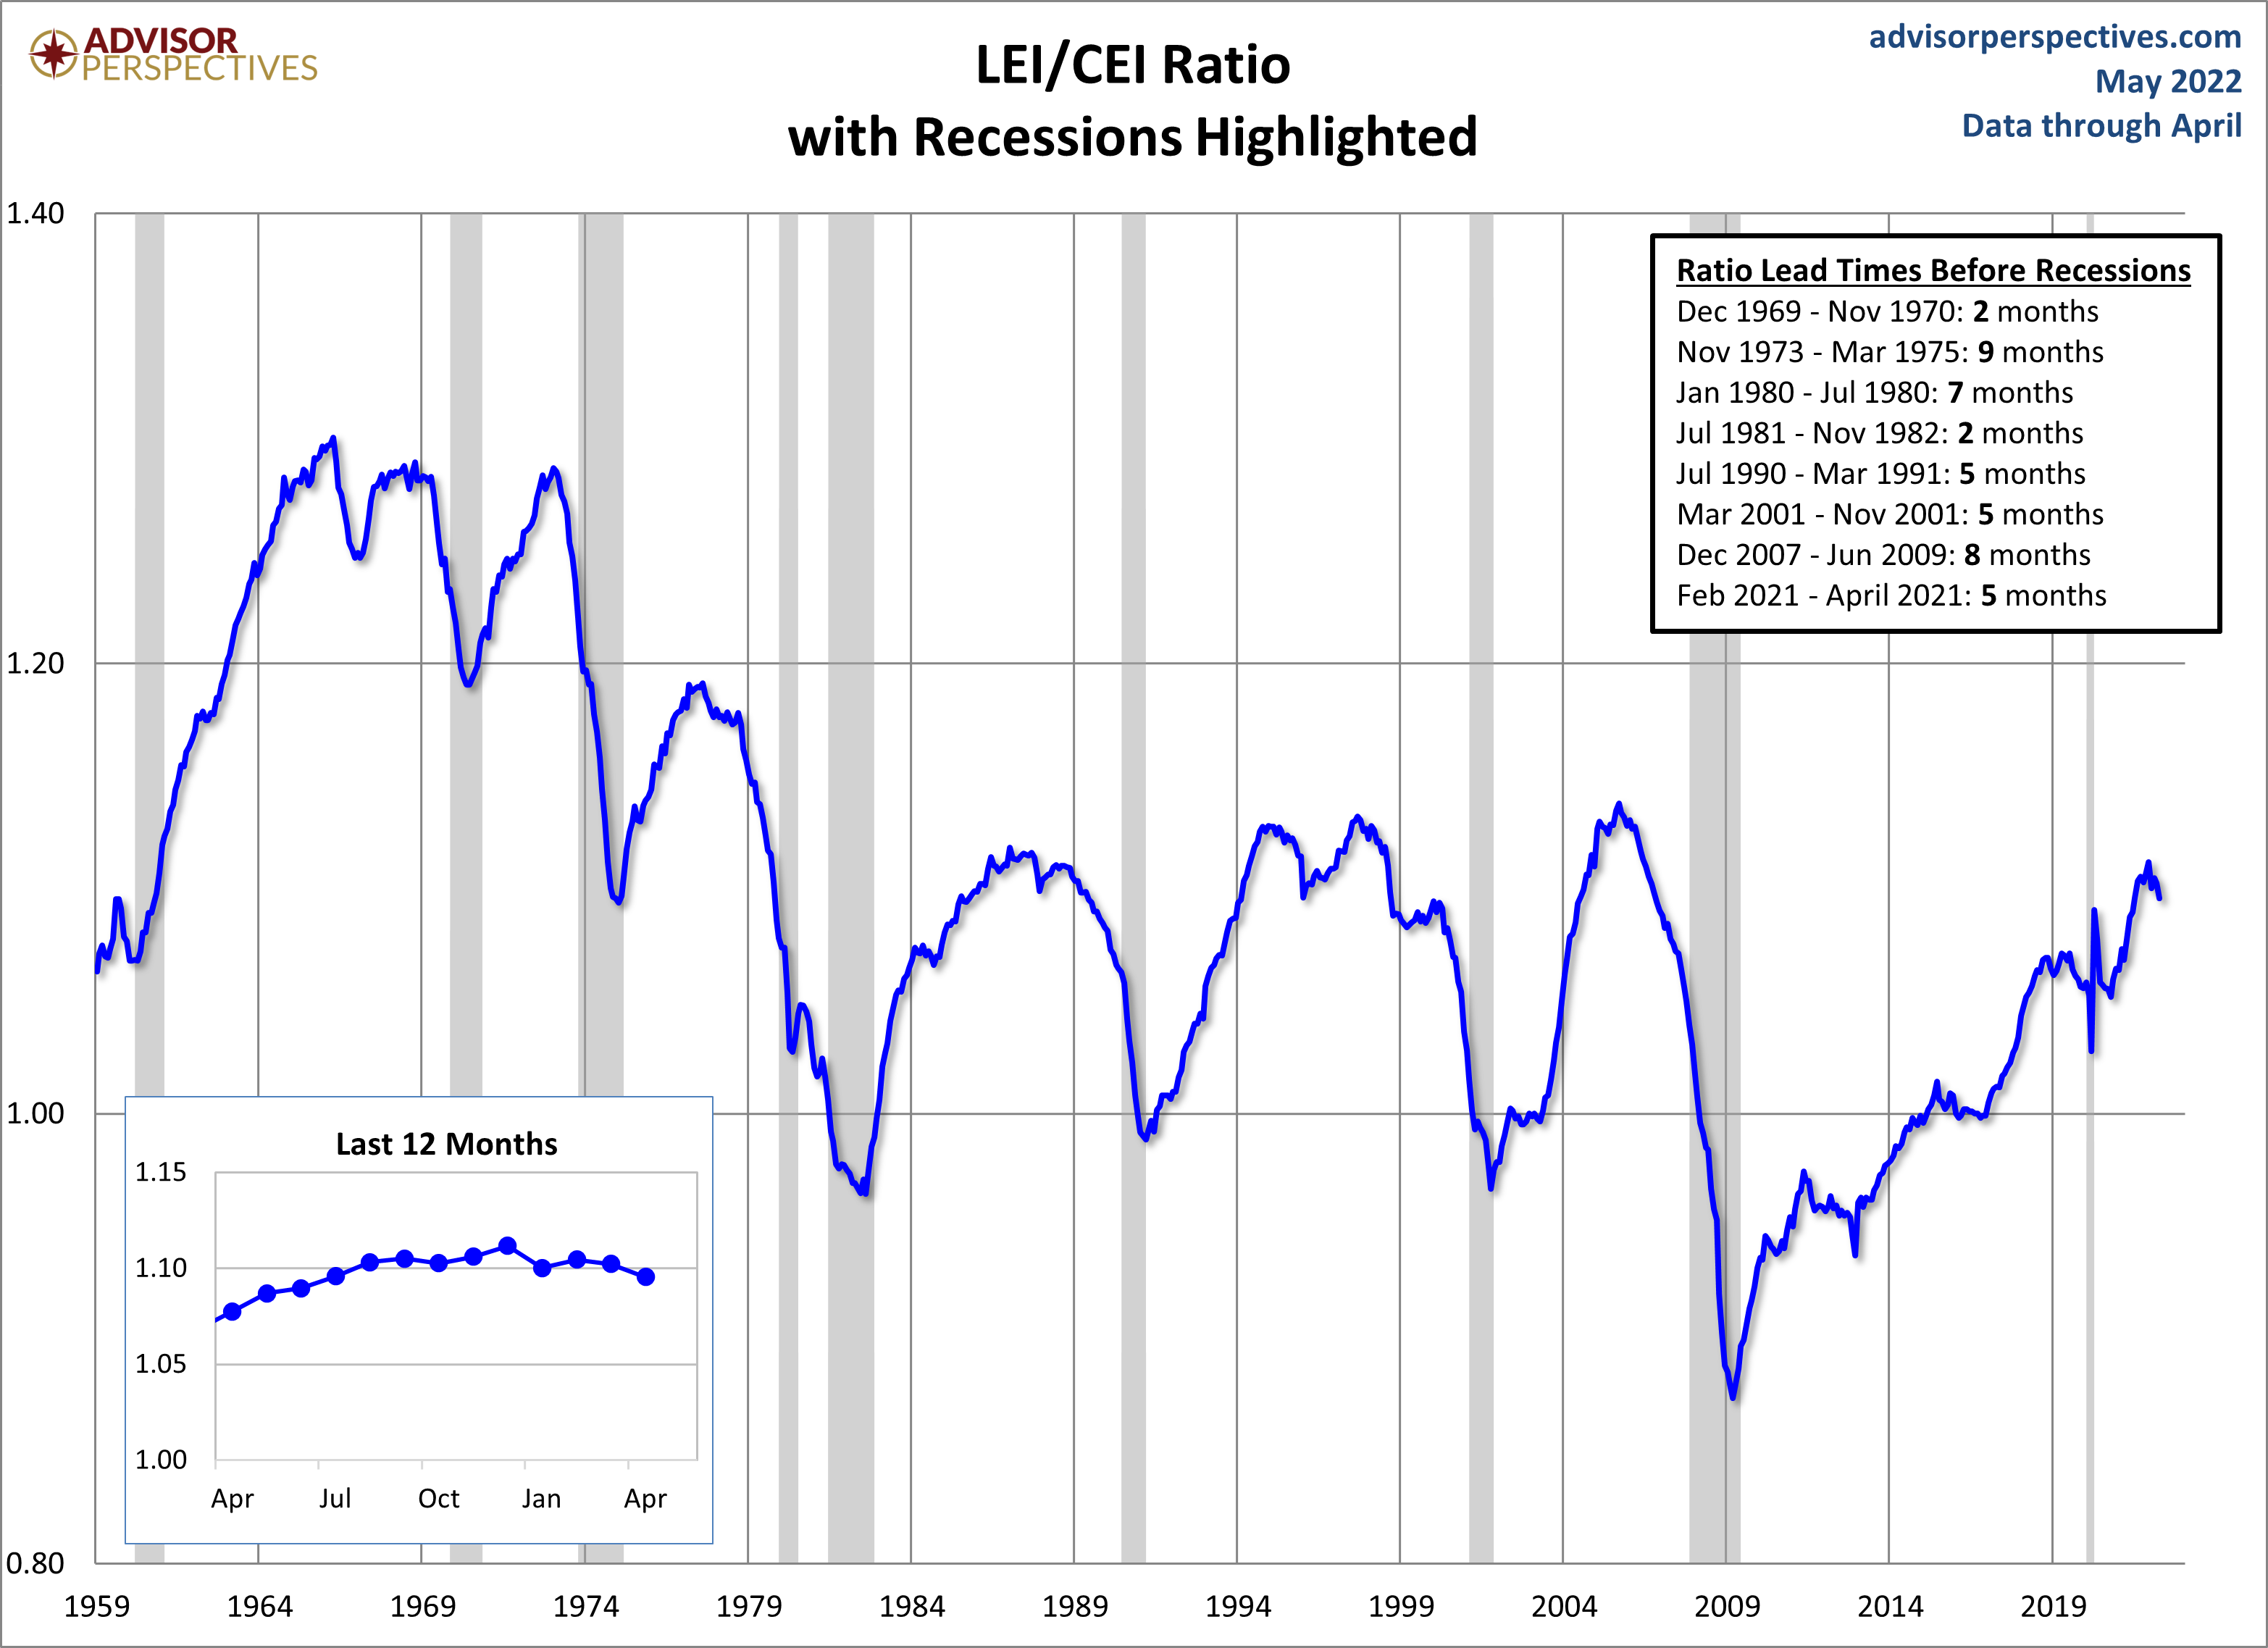
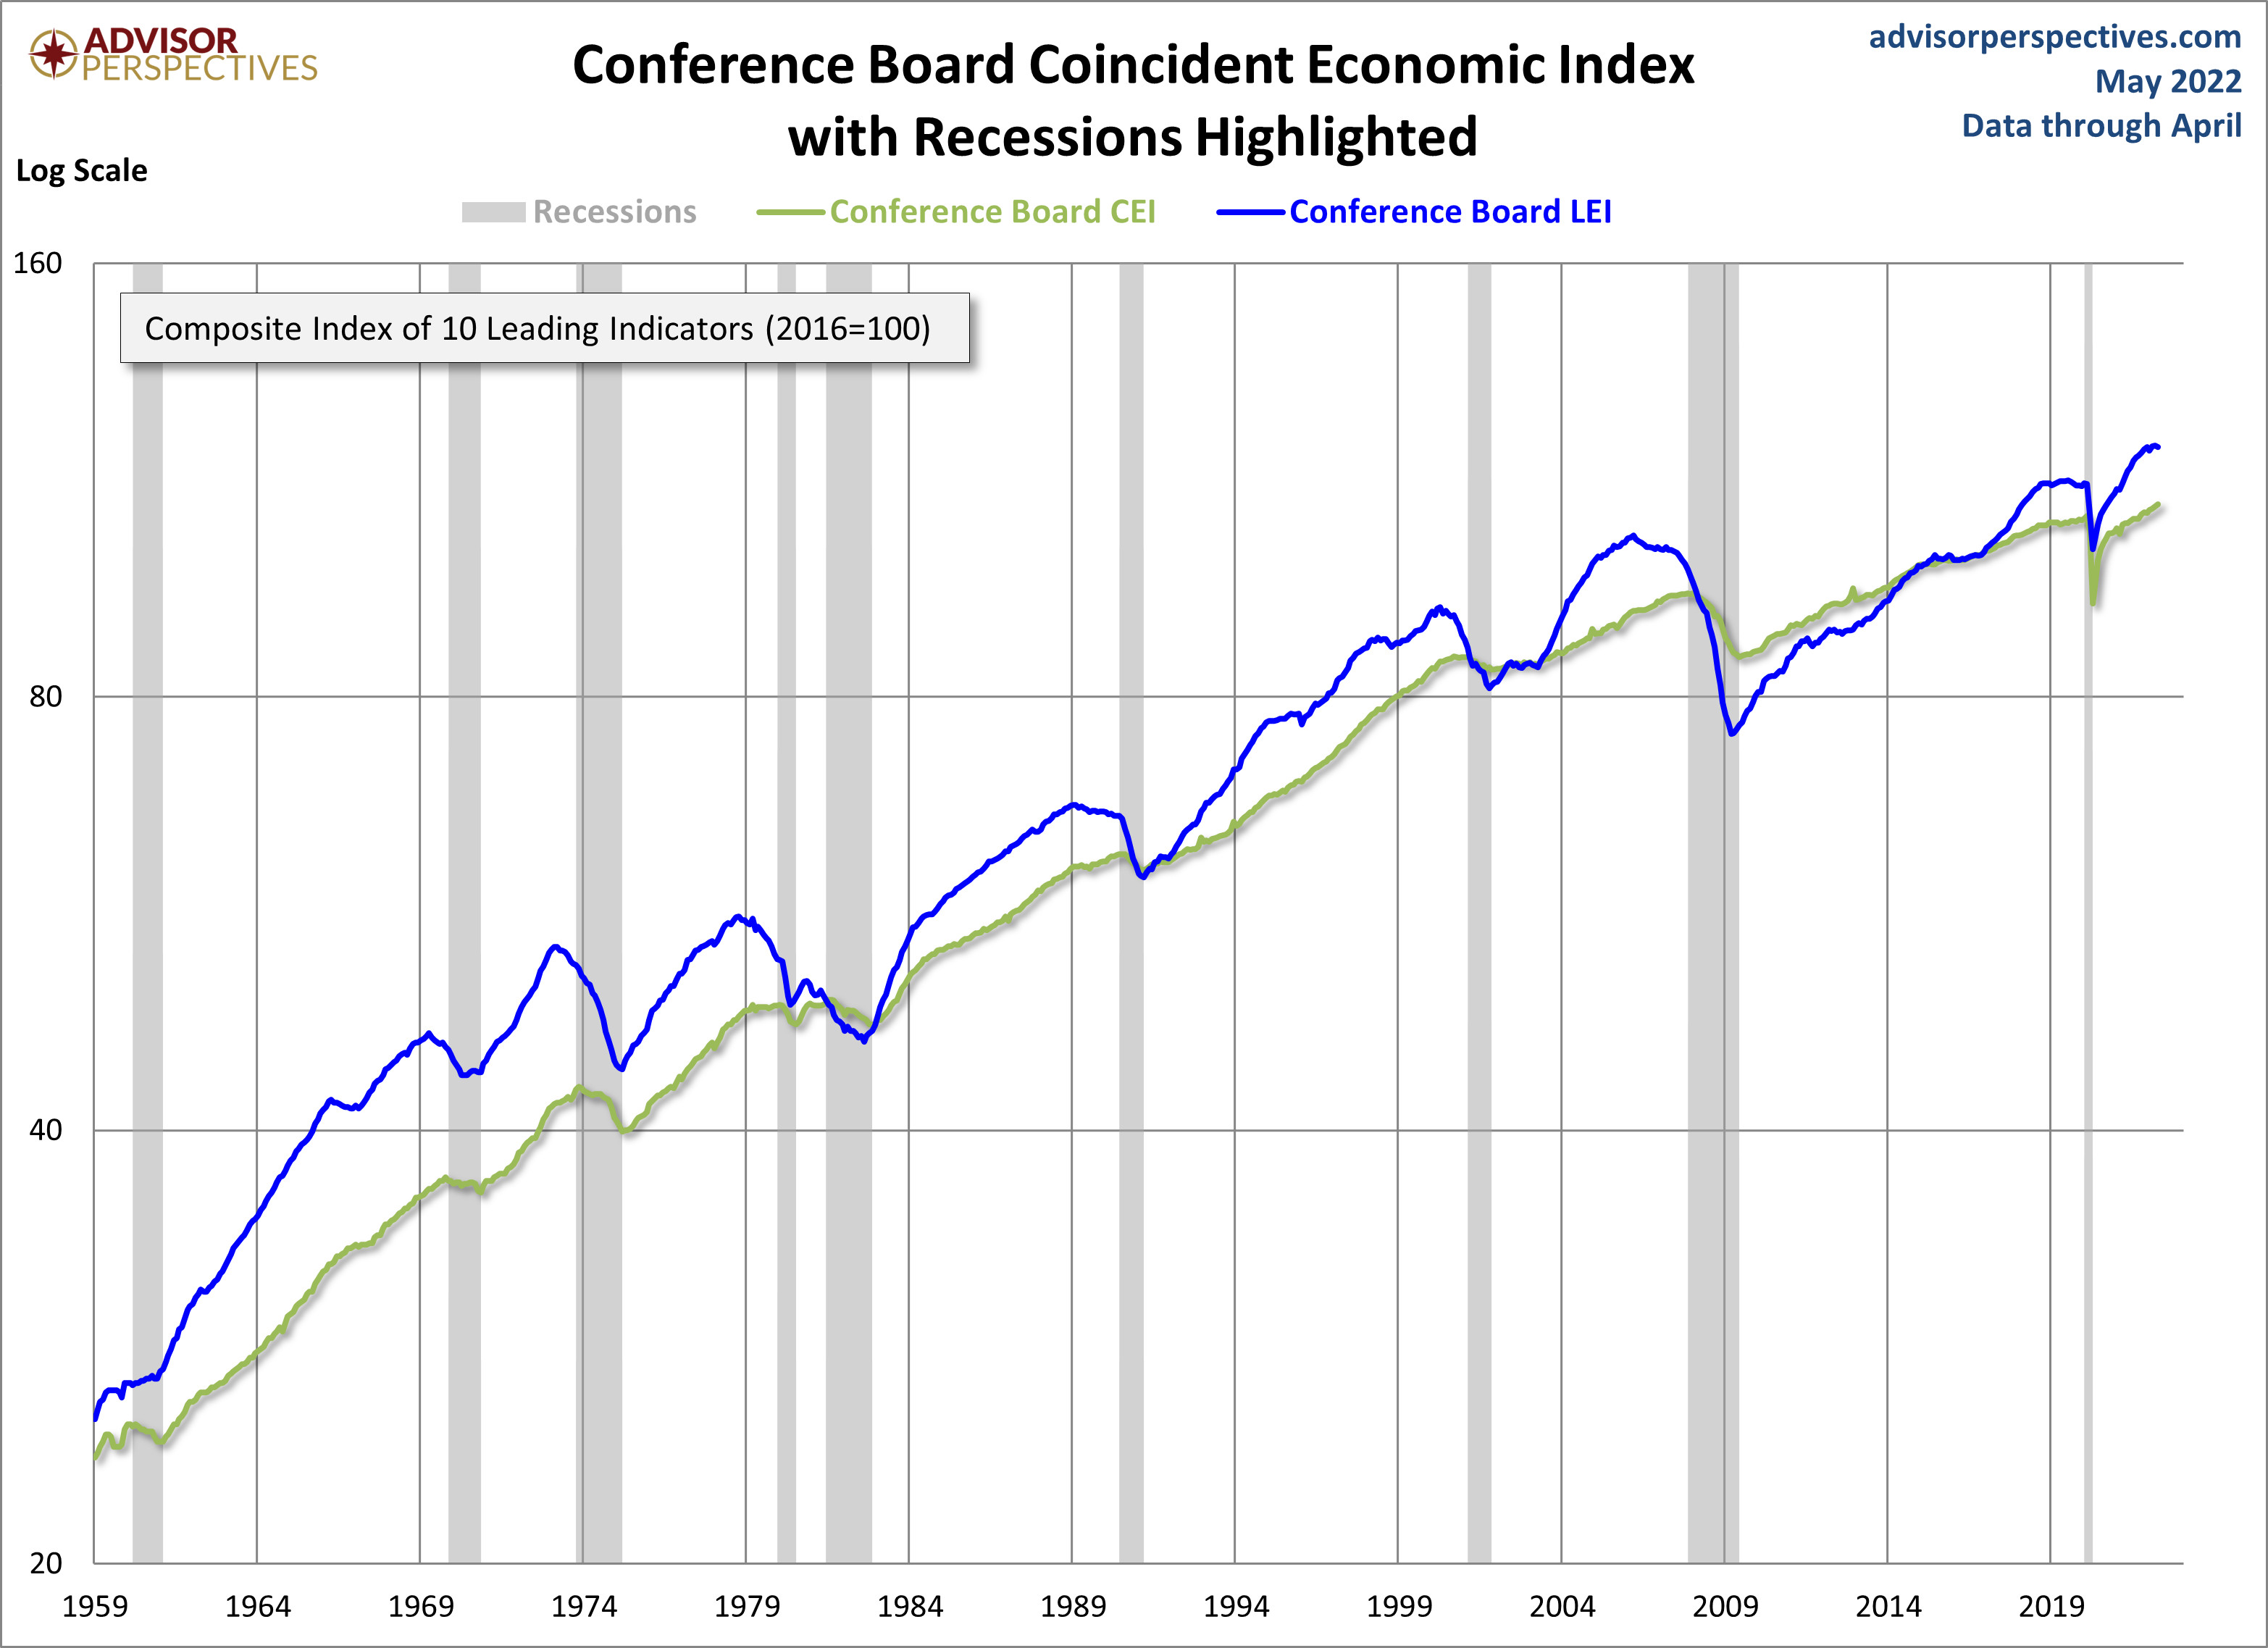
The Conference Board also includes its Coincident Economic Index (CEI) in each release. It measures current economic activity and is made up of four components: nonagricultural payroll, personal income less transfer payments, manufacturing and trade sales, and industrial production. Based on observations, when the LEI begins to decline, the CEI is still rising. Here's a chart including both the CEI and LEI.
Here is a chart of the LEI/CEI ratio, which perhaps has been a leading indicator of recessions. We count the lead time as the number of months that the ratio has been declining prior to a recession. There have been times where the ratio has been in decline for several months without a recession.