
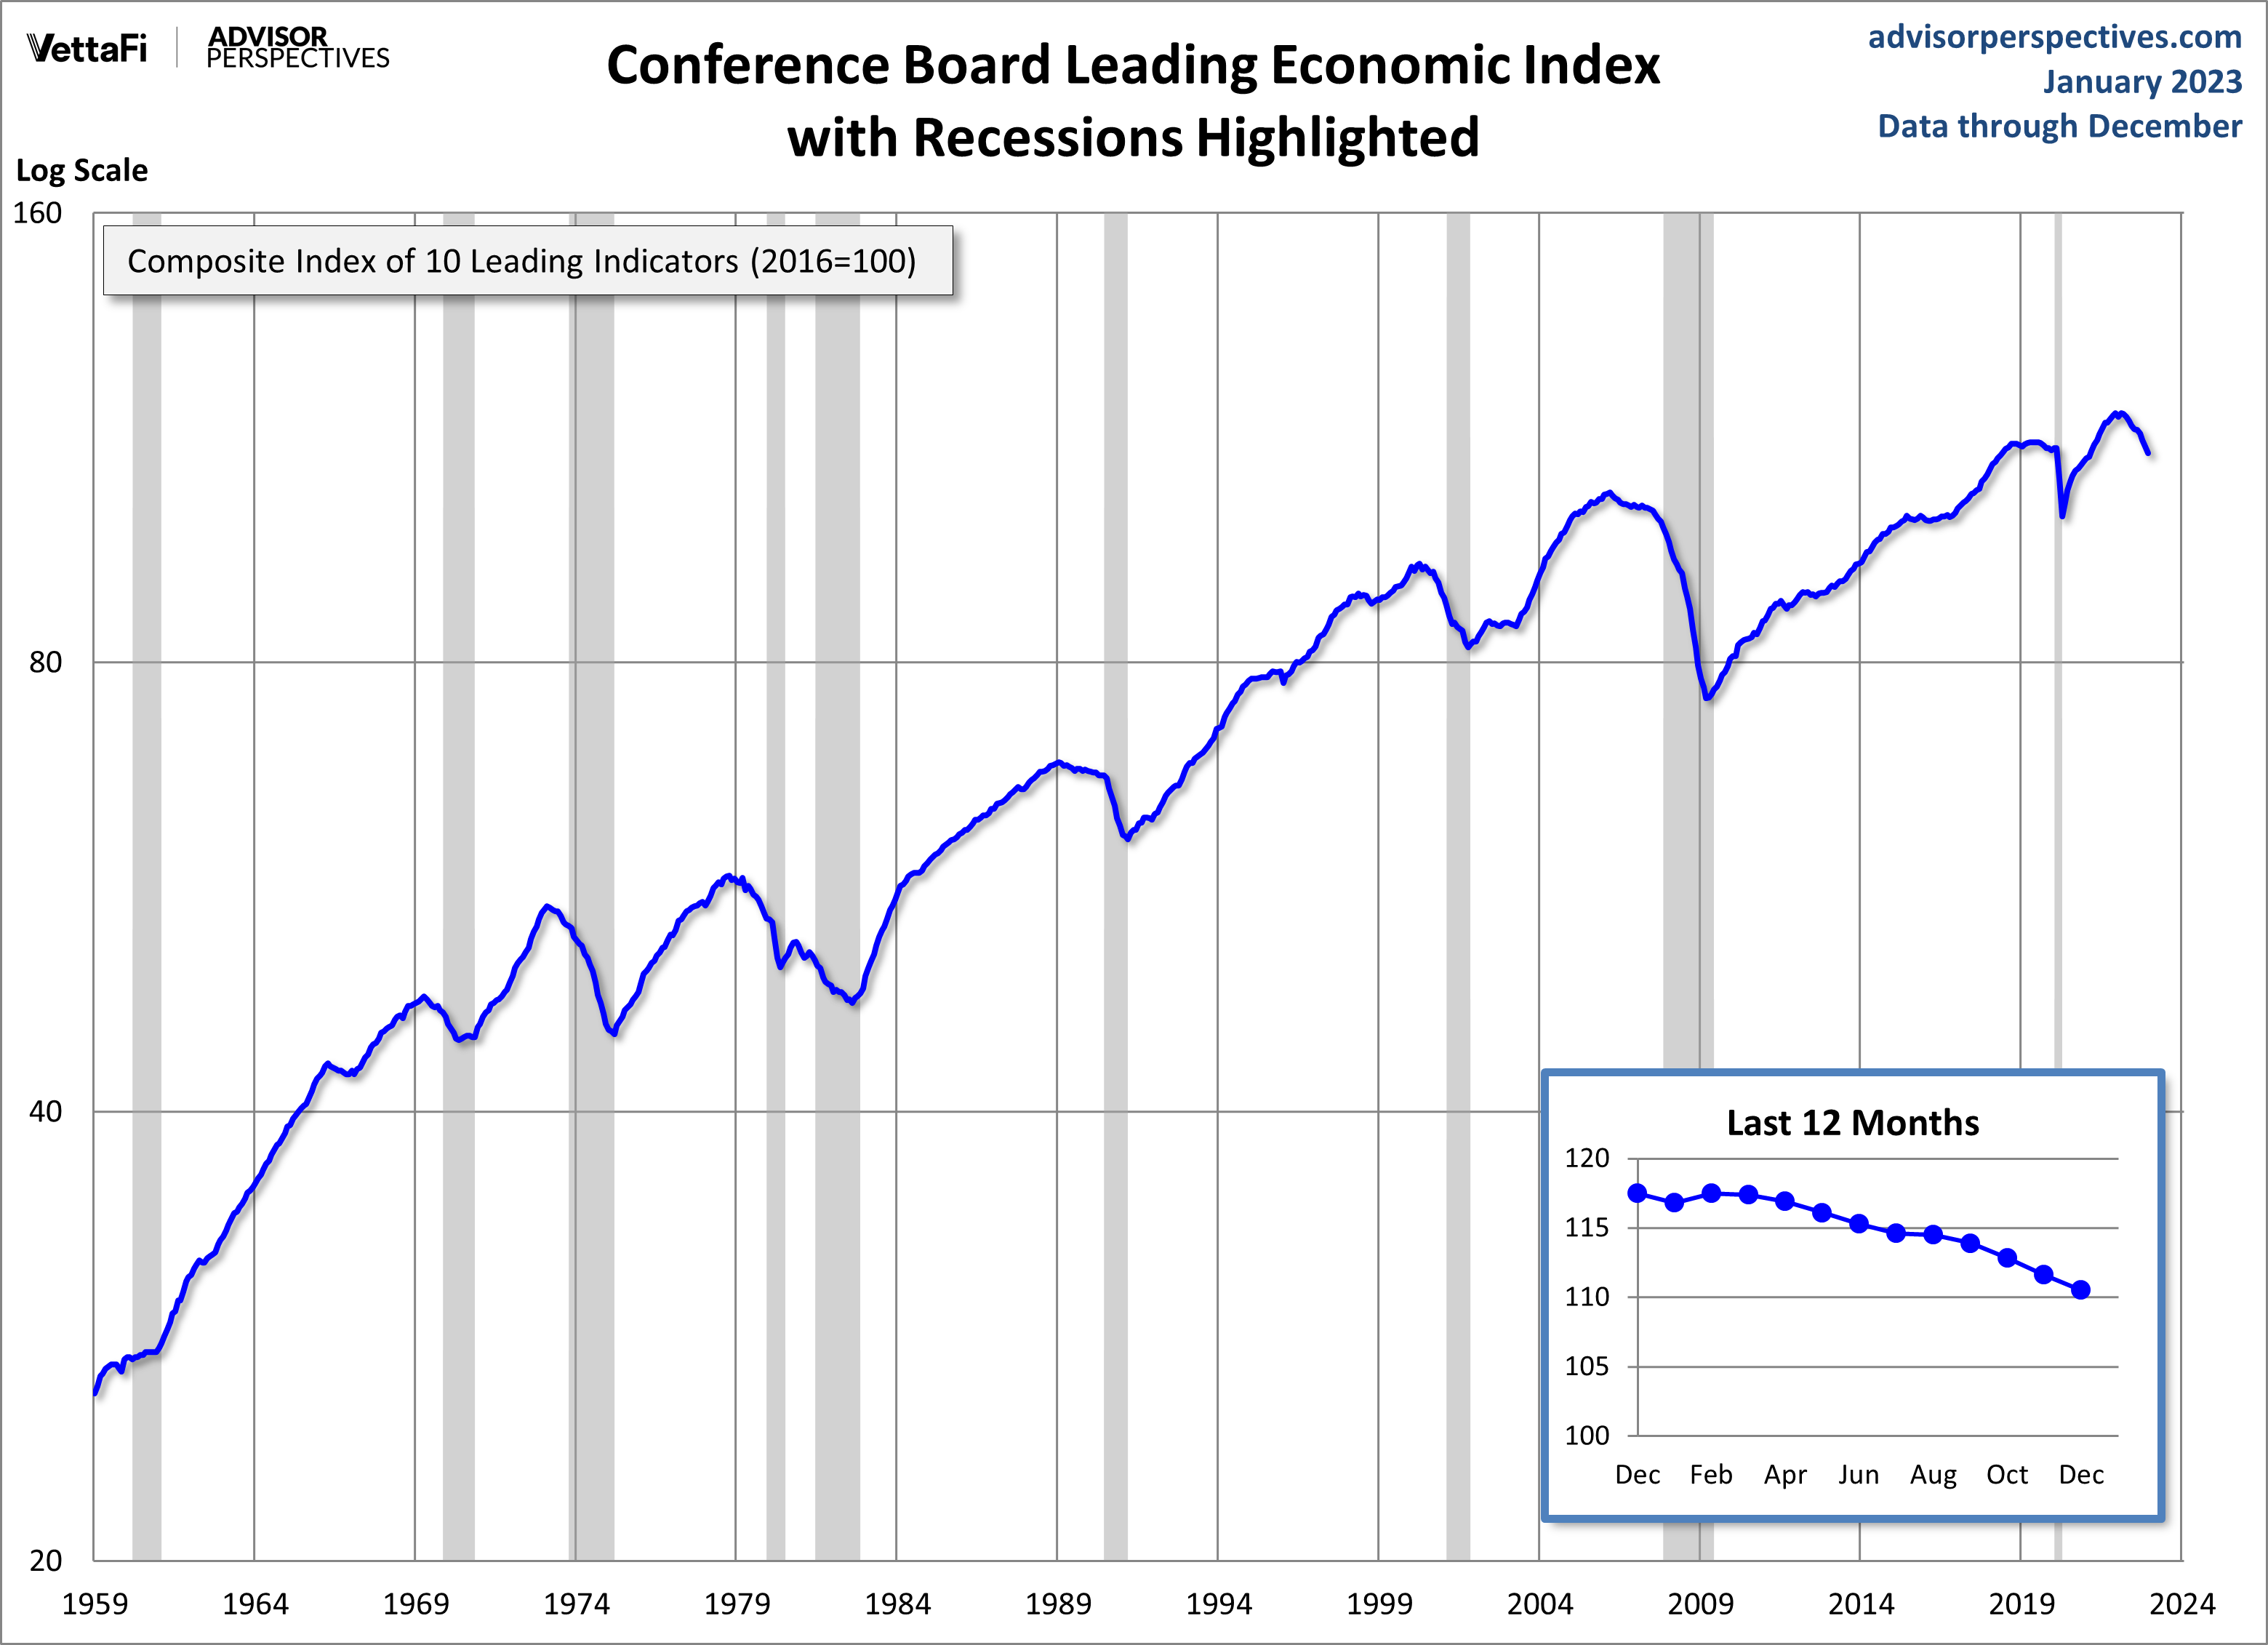
The latest Conference Board Leading Economic Index (LEI) for December was down 1% from the November final figure of 111.6, marking the 10th consecutive MoM decline.
The Conference Board Leading Economic Index® (LEI)for theU.S. decreased by 1.0 percent in December 2022 to 110.5 (2016=100), following a decline of 1.1 percent in November. The LEI is now down 4.2 percent over the six-month period between June and December 2022—a much steeper rate of decline than its 1.9 percent contraction over the previous six-month period (December 2021–June 2022).
“The US LEI fell sharply again in December—continuing to signal recession for the US economy in the near term,” said Ataman Ozyildirim, Senior Director, Economics, at The Conference Board. “There was widespread weakness among leading indicators in December, indicating deteriorating conditions for labor markets, manufacturing, housing construction, and financial markets in the months ahead. Meanwhile, the coincident economic index (CEI) has not weakened in the same fashion as the LEI because labor market related indicators (employment and personal income) remain robust. Nonetheless, industrial production— also a component of the CEI—fell for the third straight month. Overall economic activity is likely to turn negative in the coming quarters before picking up again in the final quarter of 2023.” More
Here is a log-scale chart of the LEI series with documented recessions as identified by the NBER. The use of a log scale gives us a better sense of the relative sizes of peaks and troughs than a more conventional linear scale.
For a better understanding of the relationship between the LEI and recessions, the next chart shows the percentage-off the previous peak for the index and the number of months between the previous peak and official recessions.

LEI and Its Six-Month Smoothed Rate of Change
Based on suggestions from Neile Wolfe of Wells Fargo Advisors and Dwaine Van Vuuren of RecessionAlert, we can tighten the recession lead times for this indicator by plotting a smoothed six-month rate of change to further enhance our use of the Conference Board's LEI as a gauge of recession risk.
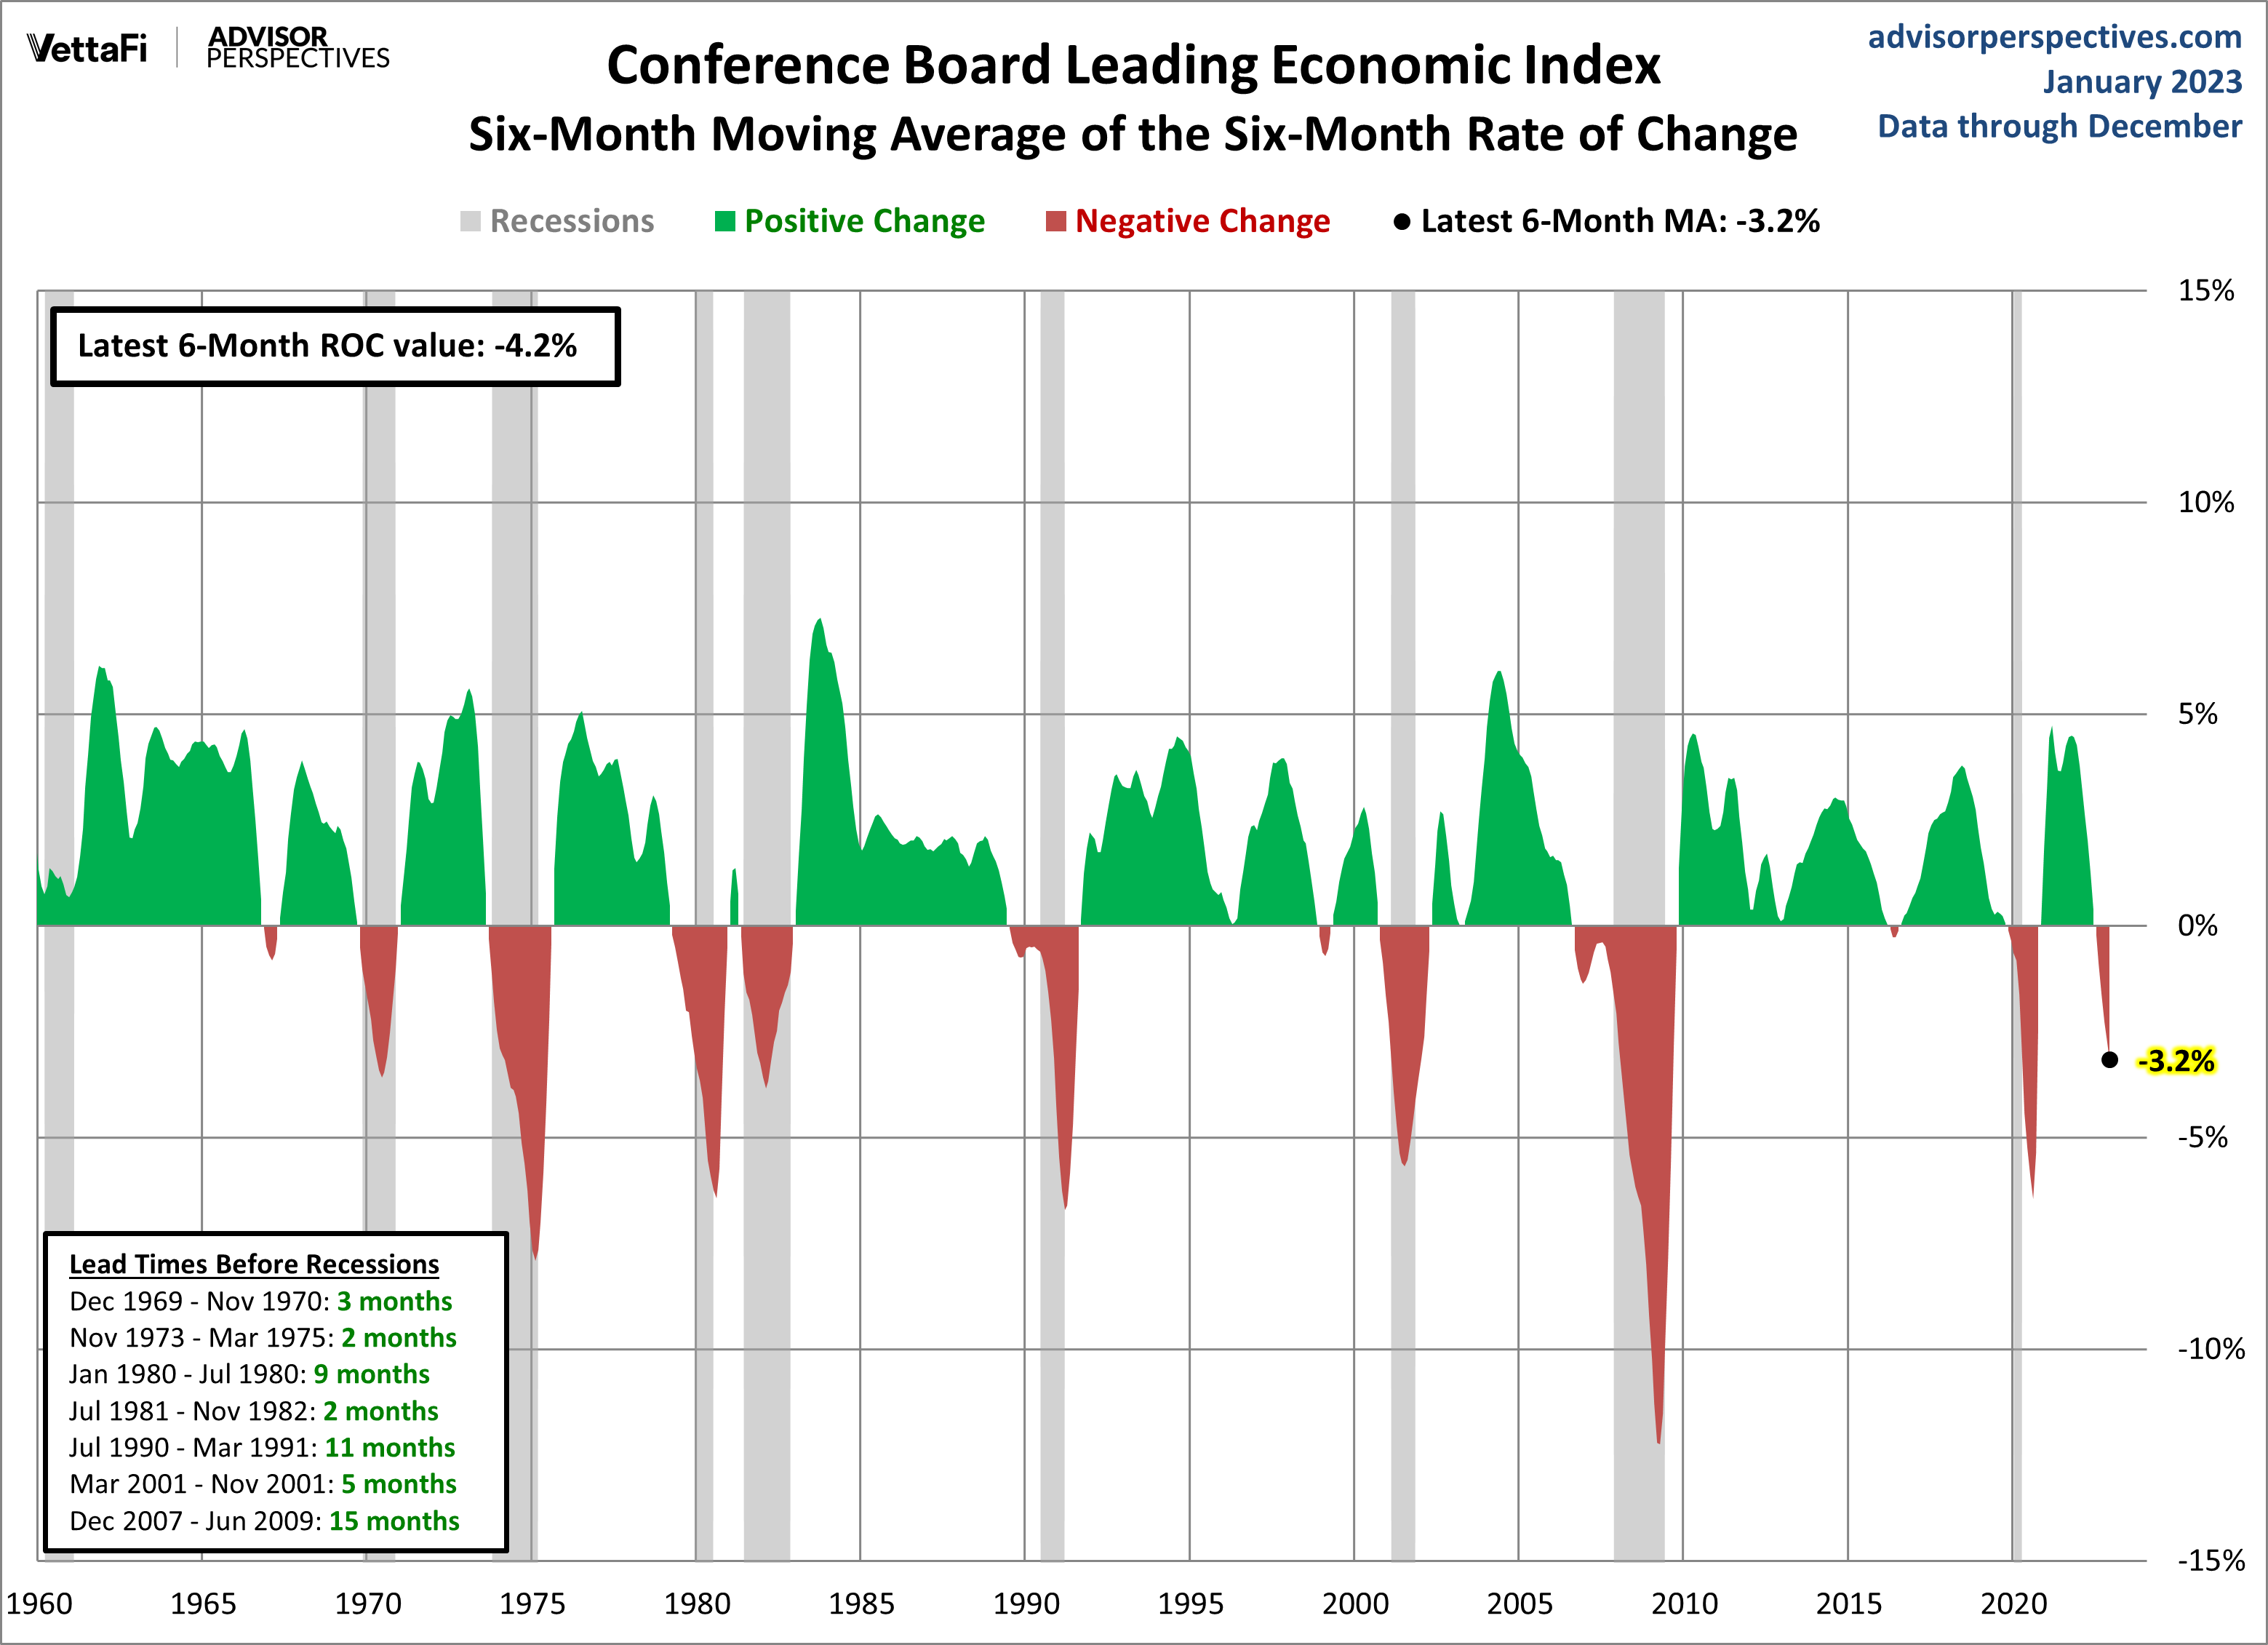
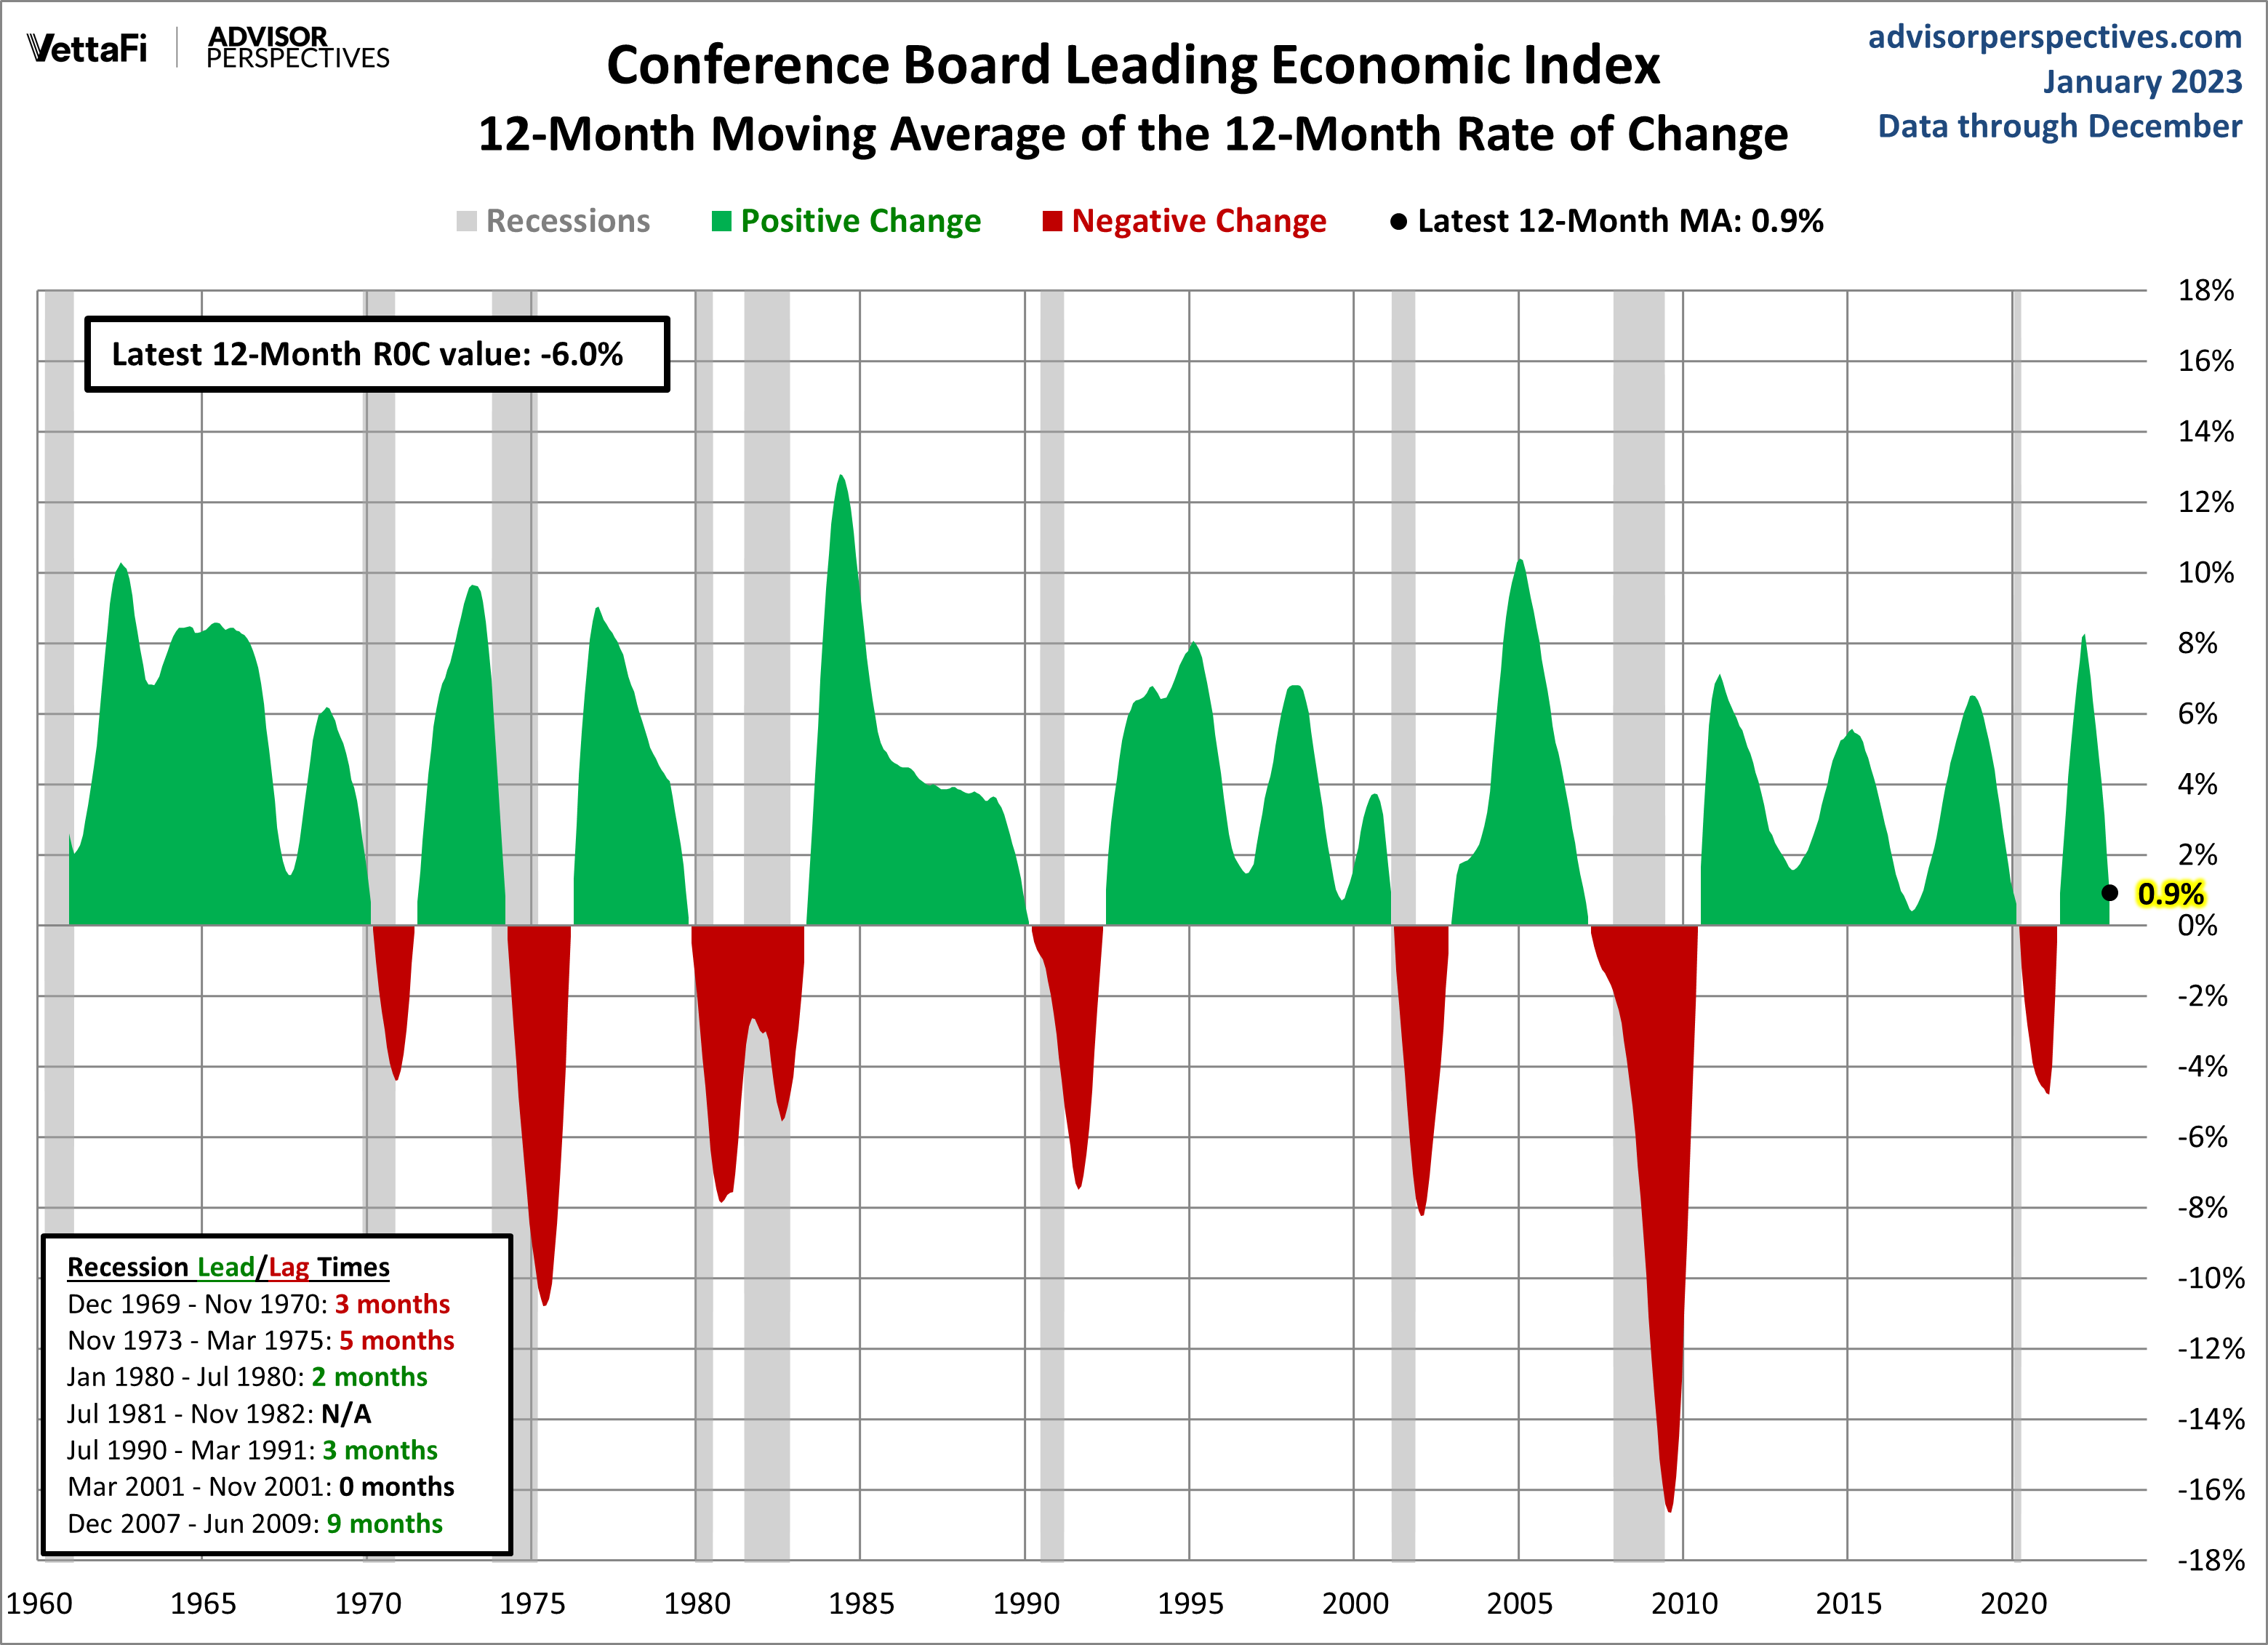
As we can see, the LEI has historically dropped below its six-month moving average anywhere between 2 to 15 months before a recession. Here is a twelve-month smoothed out version, which further eliminates the whipsaws:
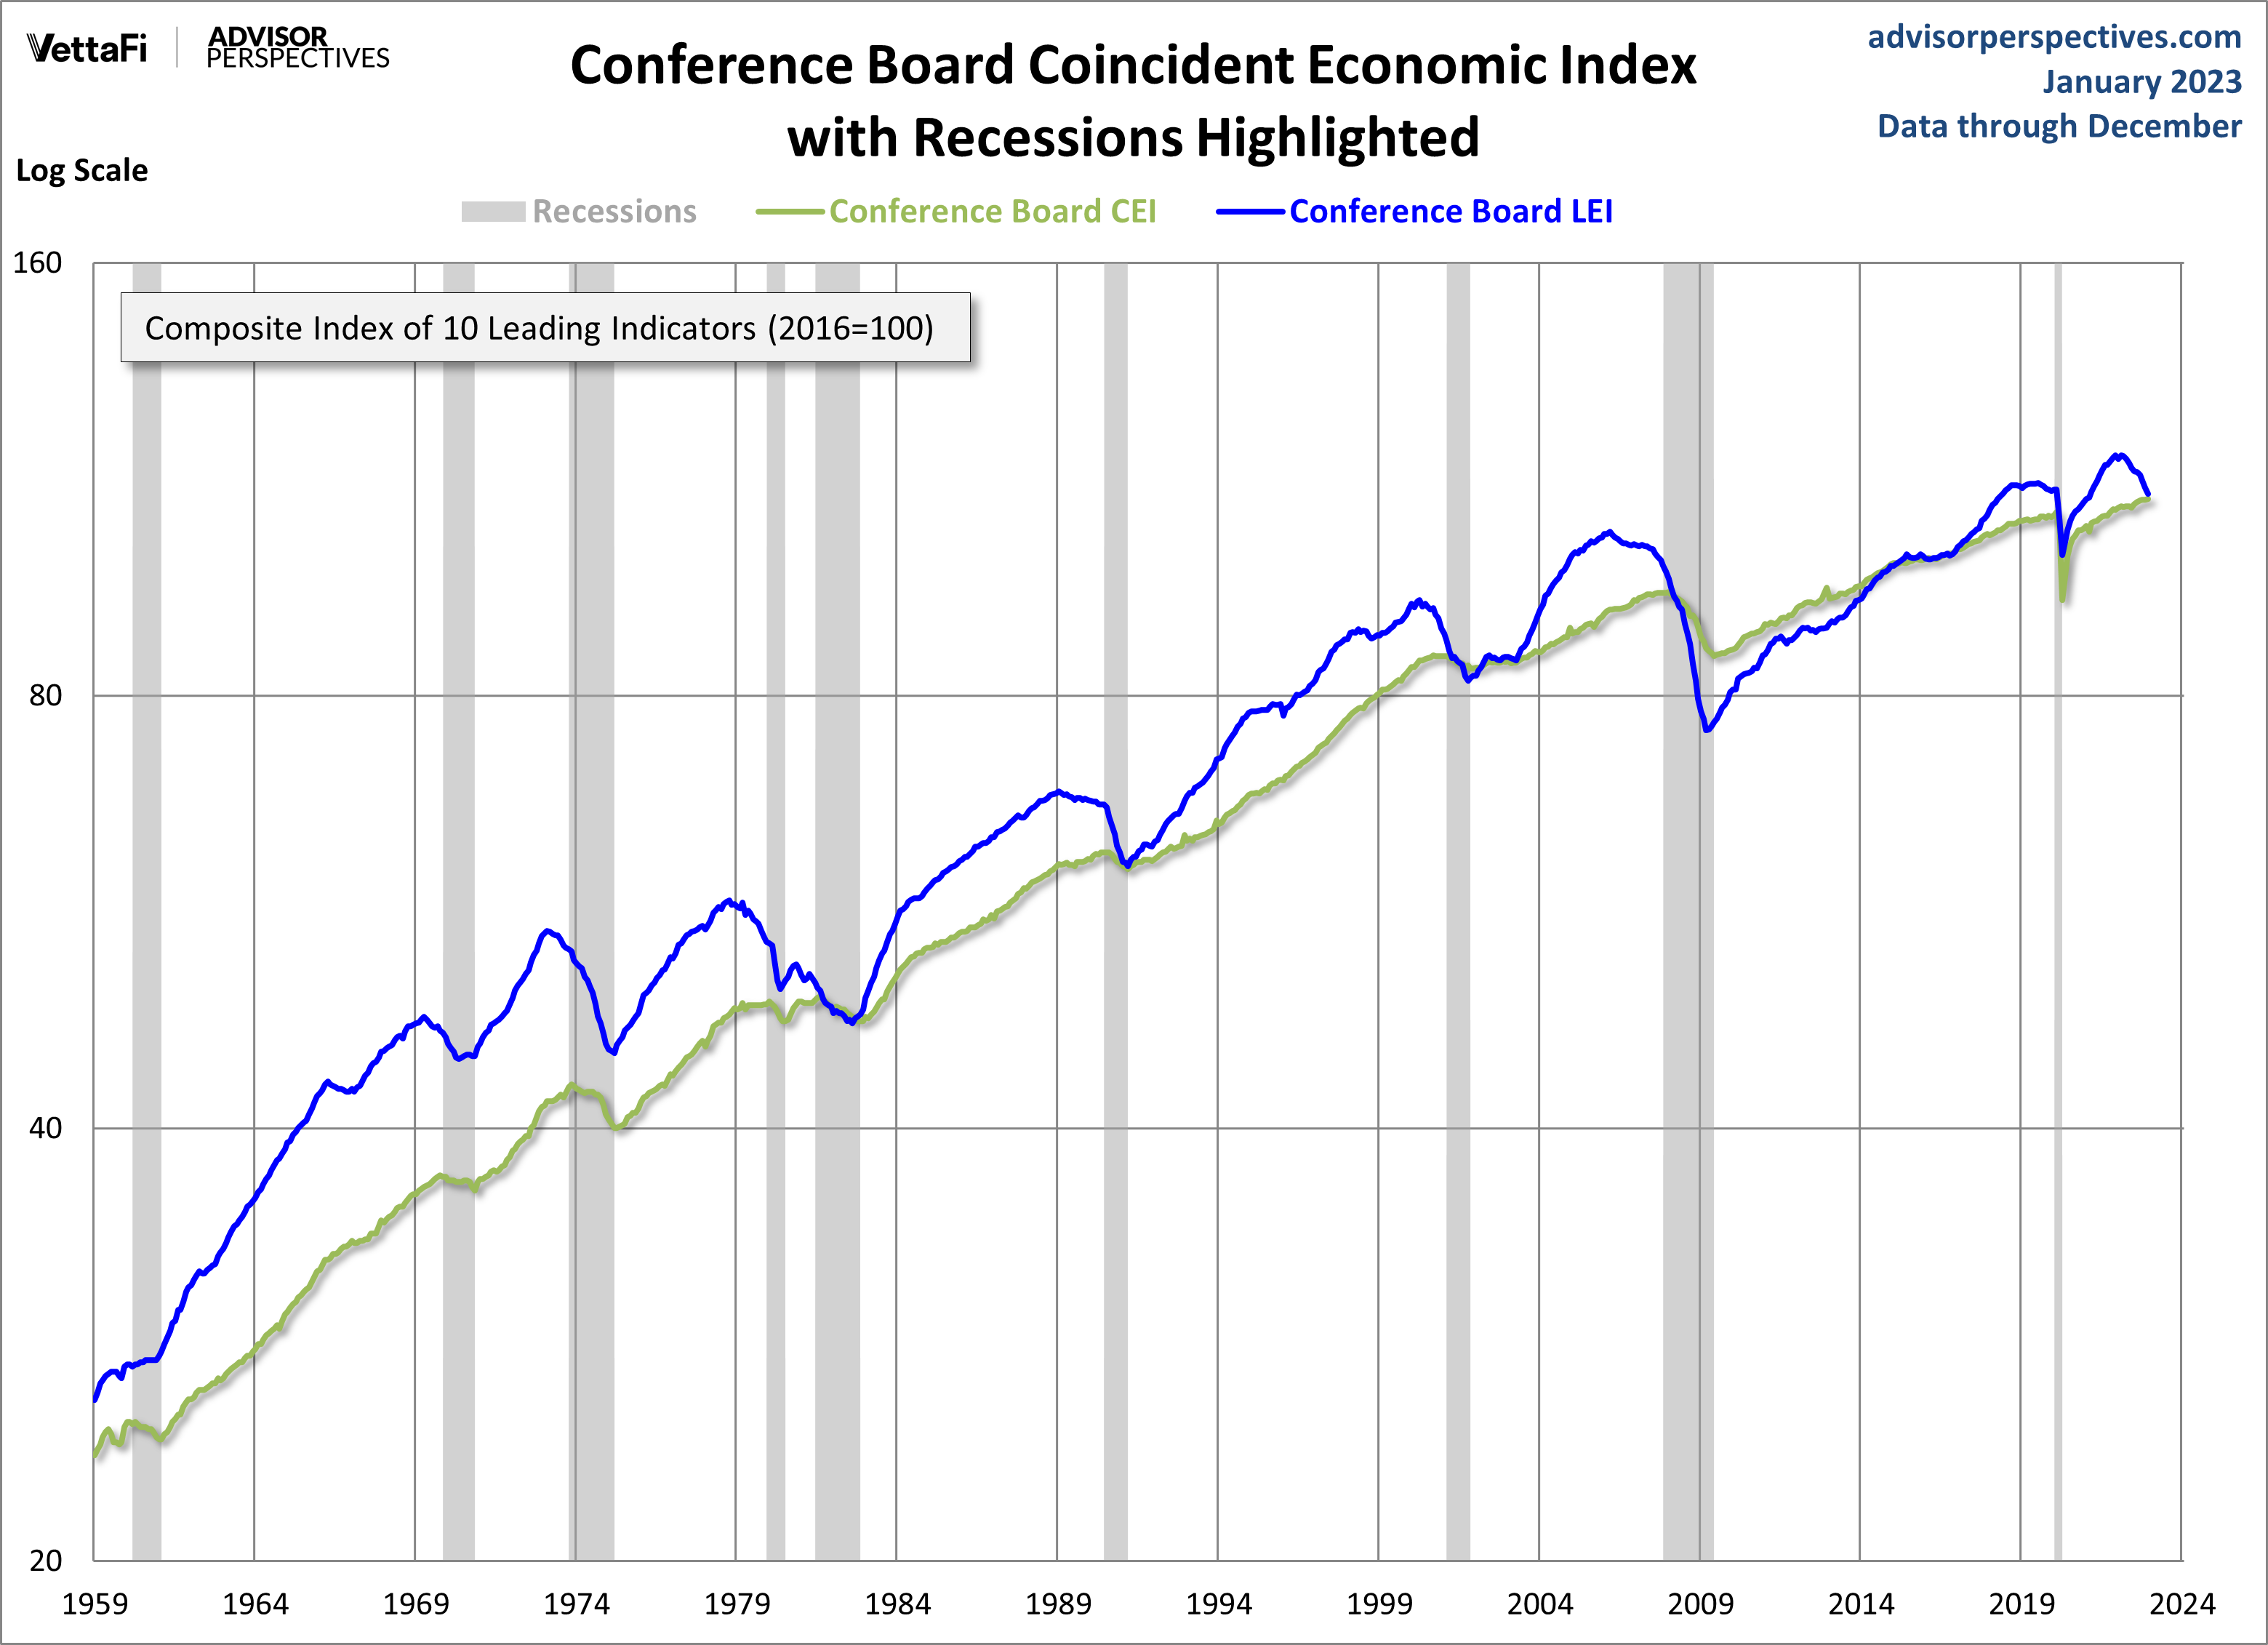
The Conference Board also includes its Coincident Economic Index (CEI) in each release. It measures current economic activity and is made up of four components: nonagricultural payroll, personal income less transfer payments, manufacturing and trade sales, and industrial production. Based on observations, when the LEI begins to decline, the CEI is still rising. Here's a chart including both the CEI and LEI.
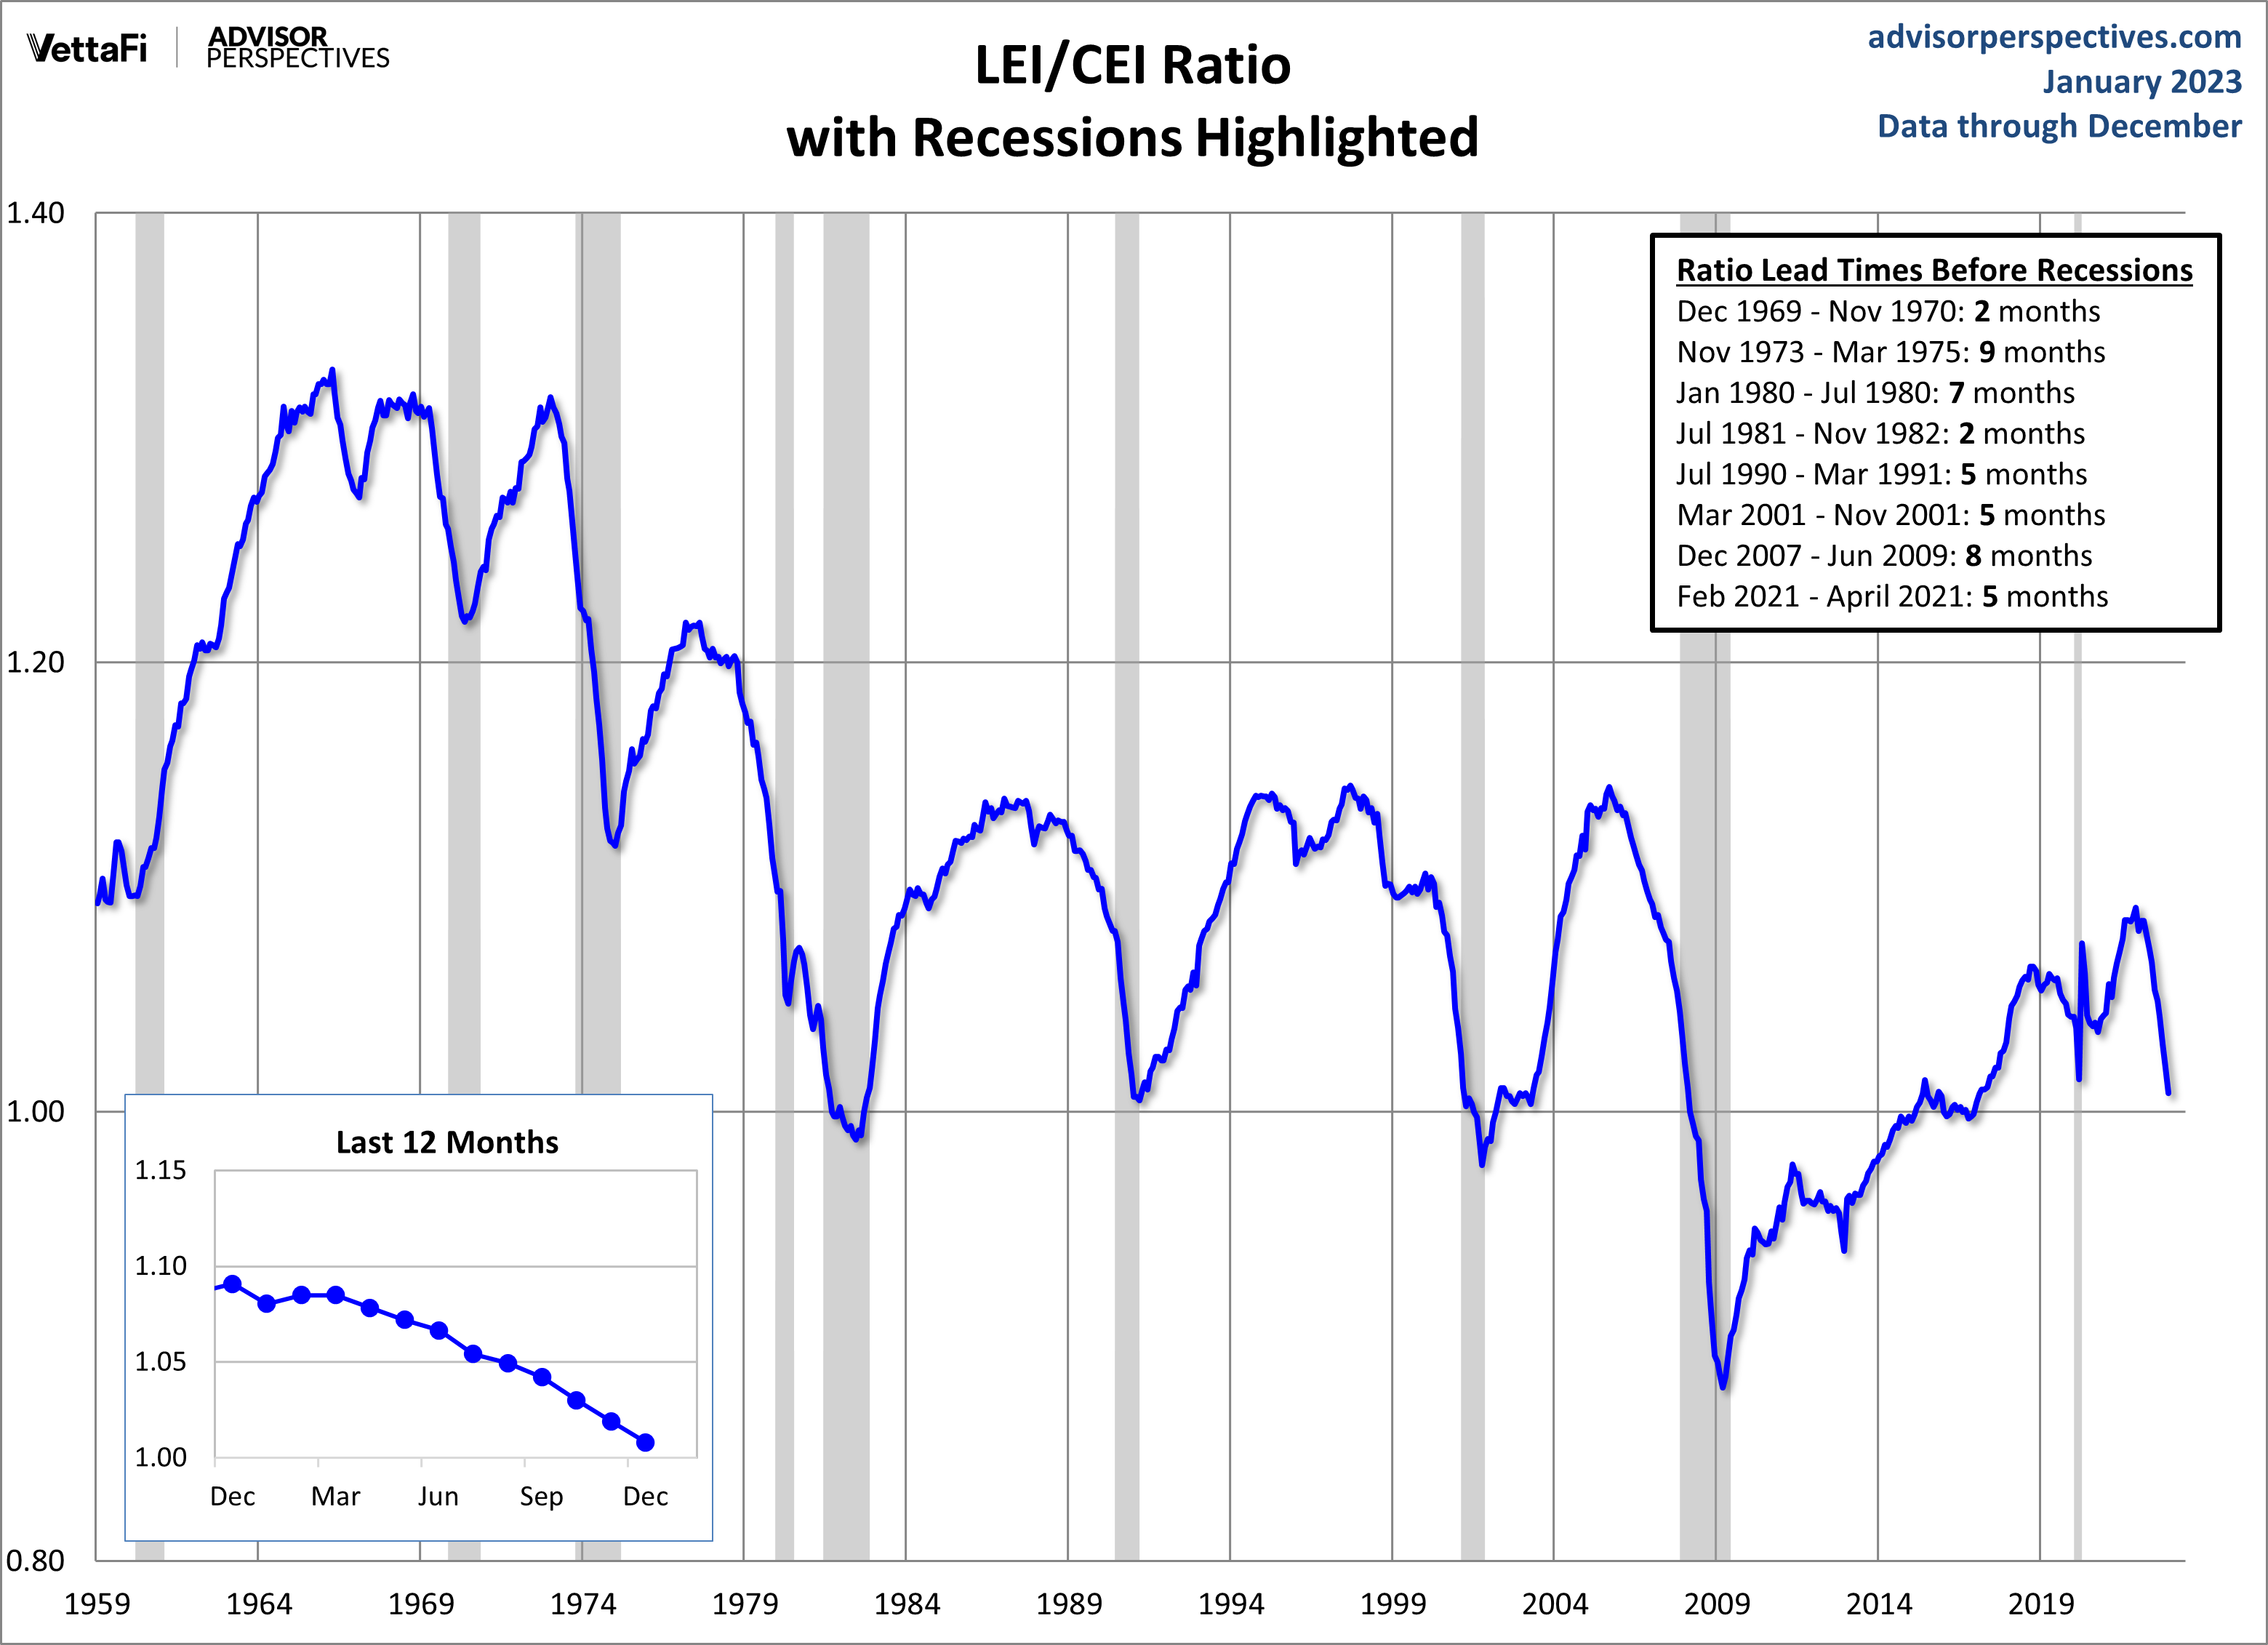
Here is a chart of the LEI/CEI ratio, which perhaps has been a leading indicator of recessions. We count the lead time as the number of months that the ratio has been declining prior to a recession. There have been times where the ratio has been in decline for several months without a recession.
More By This Author:
Margin Debt Down 5.8% In DecemberS&P 500 Snapshot: Friday Ends Up 1.89%
Middle-Class Hourly Wages As Of December 2022


Comments
Log in or sign up to join the conversation.