Case-Shiller Home Price Index July 2016 Year-over-Year Rate Of Growth Decelerates
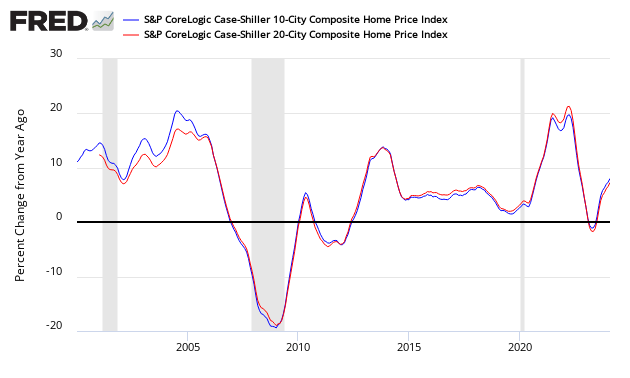
The non-seasonally adjusted Case-Shiller home price index (20 cities) year-over-year rate of home price growth slowed from 5.1 % to 5.0 %. The index authors stated the index "is within 0.6% of the record high set in July 2006. Seven of the 20 cities have already set new record highs."

Analyst Opinion of Case-Shiller HPI
Recently, there has been a moderate slowing of the Case Shiller HPI year-over-year growth. Many pundits believe home prices are back in a bubble. Maybe, but the falling inventory of homes for sale keeps home prices relatively high. I see this a situation of supply and demand. It is the affordability of the homes which is becoming an issue for the lower segments of consumers. It is my belief that if the Fed begins to normalize the federal funds rate - it will slow the growth rate of home prices.
- 20 city unadjusted home price rate of growth decelerated 0.2 % month-over-month. [Econintersect uses the change in year-over-year growth from month-to-month to calculate the change in rate of growth]
- Note that Case-Shiller index is an average of the last three months of data.
- The market expected:
| Consensus Range | Consensus | Actual | |
| 20-city, SA - M/M | -0.2 % to 0.2 % | 0.1 % | +0.0 % |
| 20-city, NSA - M/M | +0.6 % | ||
| 20-city, NSA - Yr/Yr | 4.8 % to 5.3 % | 5.2 % | +5.0 % |
S&P/Case-Shiller Home Price Indices Year-over-Year Change

Comparing all the home price indices, it needs to be understood each of the indices uses a unique methodology in compiling their index - and no index is perfect.
Comparison of Home Price Indices - Case-Shiller 3 Month Average (blue line, left axis), CoreLogic (green line, left axis) and National Association of Realtors 3 Month Average (red line, right axis)
z existing3.PNG
The way to understand the dynamics of home prices is to watch the direction of the rate of change. Here home price growth generally appears to be stabilize (rate of growth not rising or falling).
Year-over-Year Price Change Home Price Indices - Case-Shiller 3 Month Average (blue bar), CoreLogic (yellow bar) and National Association of Realtors 3 Month Average (red bar)
z existing5.PNG
There are some differences between the indices on the rate of "recovery" of home prices.
A synopsis of Authors of the Leading Indices:
Case Shiller's David M. Blitzer, Chairman of the Index Committee at S&P Indices:
Both the housing sector and the economy continue to expand with home prices continuing to rise at about a 5% annual rate. The statement issued last week by the Fed after its policy meeting confirms the central bank's view that the economy will see further gains. Most analysts now expect the Fed to raise interest rates in December. After such Fed action, mortgage rates would still be at historically low levels and would not be a major negative for house prices.
The S&P CoreLogic Case-Shiller National Index is within 0.6% of the record high set in July 2006. Seven of the 20 cities have already set new record highs. The 10-year, 20-year, and National indices have been rising at about 5% per year over the last 24 months. Eight of the cities are seeing prices up 6% or more in the last year. Given that the overall inflation is a bit below 2%, the pace is probably not sustainable over the long term. The run-up to the financial crisis was marked with both rising home prices and rapid growth in mortgage debt. Currently, outstanding mortgage debt on one-to-four family homes is 12.6% below the peak seen in the first quarter of 2008 and up less than 2% in the last four quarters. There is no reason to fear that another massive collapse is around the corner."
CoreLogic believes low inventories are spurring rising home prices (July 2016 Data). Per Dr Frank Nothaft, chief economist for CoreLogic and Anand Nallathambi, president and CEO of CoreLogic stated:
If mortgage rates continue to remain relatively low and job growth continues, as most forecasters expect, then home purchases are likely to rise in the coming year. The increased sales will support further price appreciation, and according to the CoreLogic Home Price Index, home prices are projected to rise about 5 percent over the next year.
The strongest home price gains continue to be in the western region. As evidence, the Denver, Portland and Seattle metropolitan areas all recorded double-digit appreciation over the past year.
The National Association of Realtors says home sales prices continue to increase (August 2016 data):
Lawrence Yun, NAR chief economist, says recent job growth is not yielding higher home sales. "Healthy labor markets in most the country should be creating a sustained demand for home purchases," he said. "However, there's no question that after peaking in June, sales in a majority of the country have inched backwards because inventory isn't picking up to tame price growth and replace what's being quickly sold."
Added Yun, "Hopes of a meaningful sales breakthrough as a result of this summer's historically low mortgage rates failed to materialize because supply and affordability restrictions continue to keep too many would-be buyers on the sidelines."
"It's very concerning to see that inventory conditions not only show no signs of improving but have actually worsened in recent months from their already suppressed levels a year ago," added Yun. "While recent data from the U.S. Census Bureau (link is external) shows that household incomes rose strongly last year, home prices are still outpacing incomes in many metro areas because of the persistent shortage of new and existing homes for sale. Without more supply, the U.S. homeownership rate will remain near 50-year lows."
NAR President Tom Salomone, says in today's fast-moving market, a Realtor® who knows about down payment options4and their target area is essential to a successful buying experience. "Given the inventory shortages in most markets, new listings at affordable prices are receiving multiple offers and going under contract almost immediately upon becoming available," he said. "Home shoppers serious about buying need to be ready with a pre-approval. This allows a Realtor® to hone in only on homes within the buyer's price range and ensures any offer presented to the seller is taken seriously."
Black Knight Financial Services (formerly known as Lender Processing Services) June 2016 home price index Up 0.4 Percent for the Month; Up 5.3 Percent Year-Over-Year (unchanged from last month). Note that Black Knight uses the current month closings only (not a three month average like Case-Shiller or a weighted average like CoreLogic), excludes short sales and REOs, and is not seasonally adjusted.
Econintersect publishes knowledgeable views of the housing market.
Caveats on the Use of Home Price Indices
The housing price decline seen since 2005 varies by zip code - and seems to have ended somewhere around the beginning of the 2Q2012. Every area of the country has differing characteristics. Since January 2006, the housing declines in Charlotte and Denver are well less than 10%, while Las Vegas home prices had declined almost 60%.
Each home price index uses a different methodology - and this creates slightly different answers.
The most broadly based index is the US Federal Housing Finance Agency's House Price Index (HPI) - a quarterly broad measure of the movement of single-family house prices. This index is a weighted, repeat-sales index on the same properties in 363 metro centers, compared to the 20 cities Case-Shiller.
The US Federal Housing Finance Agency also has an index (HPIPONM226S) based on 6,000,000 same home sales - a much broader index than Case-Shiller. Also, there is a big difference between home prices and owner's equity (OEHRENWBSHNO) which has been included on the graph below.
Comparing Various Home Price Indices to Owner's Equity (blue line)


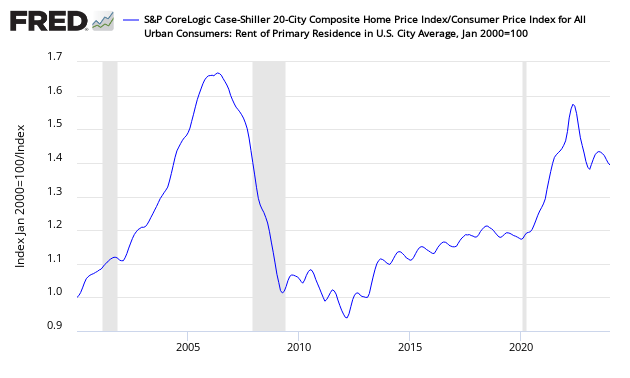
With rents increasing and home prices declining - the affordability factor favoring rental vs owning is reversing. Rising rents are shifting the balance.
Price to Rent Ratio - Indexed on January 2000 - Based on Case-Shiller 20 cities index ratio to CPI Rent Index

Disclosure: None.


