

Image Source: Unsplash
The Canadian Dollar (CAD) is mostly lower on Thursday as broader markets pivot into safe haven currencies after US inflation from the Consumer Price Index (CPI) ticked broadly higher than markets were expecting, widening the gap between market hopes of a March rate cut and the Federal Reserve’s (Fed) current stance.
Economic data from Canada remains absent from the data docket for the rest of the week, leaving CAD traders waiting for next week’s Canada CPI print as well as Canadian Retail Sales figures from November, due next Tuesday and Friday, respectively.
Daily digest market movers: Canadian Dollar follows broader market lower as markets pile into the safe haven Greenback
- Canadian Dollar sees declines as markets bid up the US Dollar post-CPI.
- US inflation is driving markets into safe havens after US CPI broadly thumped market forecasts.
- CAD is getting little support from Crude Oil despite a near-term rise in barrel bids, WTI clips back over $73.50.
- Headline monthly US CPI inflation ticked higher in December to 0.3% versus the forecast of 0.2%, climbing over November’s 0.1%.
- Annualized CPI inflation rose to 3.4% in December, climbing over the median market forecast of 3.2% and extending from November’s annualized 3.1% print.
- Core annualized CPI through December fell from the previous 4.0% to 3.9%, but less than the market’s 3.8% forecast.
- Despite the upside surprise in US CPI inflation, bond markets remain stubbornly resilient even as safe havens climb and equities decline.
- Policy-sensitive 2-year US Treasury yield staunchly continues to bet on rate cuts sooner rather than later as yield slips a scant 0.2%.
- Up next: US Producer Price Index (PPI) inflation on Friday, where markets will be hoping for further price declines on the front end of the supply chain.
- Core PPI (headline PPI less volatile food and energy prices) is expected to decline from 2.0% to 1.9% for the year ending in December.
Canadian Dollar price today
The table below shows the percentage change of Canadian Dollar (CAD) against listed major currencies today. Canadian Dollar was the weakest against the US Dollar.
| USD | EUR | GBP | CAD | AUD | JPY | NZD | CHF | |
| USD | 0.27% | 0.30% | 0.46% | 0.75% | 0.26% | 0.39% | 0.59% | |
| EUR | -0.27% | 0.03% | 0.18% | 0.49% | -0.01% | 0.08% | 0.34% | |
| GBP | -0.31% | -0.02% | 0.16% | 0.47% | -0.04% | 0.07% | 0.31% | |
| CAD | -0.47% | -0.19% | -0.15% | 0.30% | -0.20% | -0.09% | 0.17% | |
| AUD | -0.76% | -0.47% | -0.43% | -0.29% | -0.48% | -0.39% | -0.13% | |
| JPY | -0.27% | 0.00% | 0.04% | 0.17% | 0.47% | 0.07% | 0.33% | |
| NZD | -0.39% | -0.07% | -0.05% | 0.10% | 0.39% | -0.10% | 0.27% | |
| CHF | -0.60% | -0.33% | -0.30% | -0.13% | 0.16% | -0.34% | -0.22% |
The heat map shows percentage changes of major currencies against each other. The base currency is picked from the left column, while the quote currency is picked from the top row. For example, if you pick the Euro from the left column and move along the horizontal line to the Japanese Yen, the percentage change displayed in the box will represent EUR (base)/JPY (quote).
Technical Analysis: Canadian Dollar backslides in broad-market US Dollar bid
The Canadian Dollar (CAD) is broadly lower on Thursday, gaining a quarter of a percent against the Australian Dollar (AUD) and a scant tenth of a percent against the Swiss Franc (CHF). The Loonie has shed a fifth of a percent against both the Japanese Yen (JPY) and the Euro (EUR), and the CAD has also slumped around half a percent against the US Dollar heading into the tail end of the trading week.
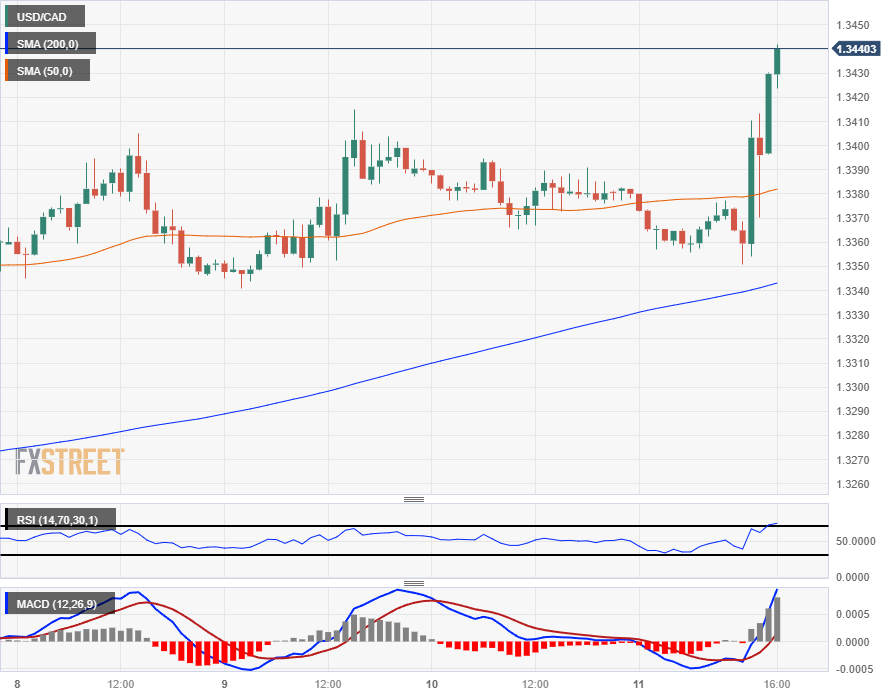
The Canadian Dollar tumbled against the US Dollar post-CPI, sending the USD/CAD pair toward 1.3450 after hitting a near-term low of 1.3350 in the run-up to US inflation prints.
Intraday, USD/CAD bids continue to be buoyed above the 200-hour Simple Moving Average (SMA) near 1.3340. Prices continue to run above the near-term median since crossing the moving average at the outset of 2024’s trading.
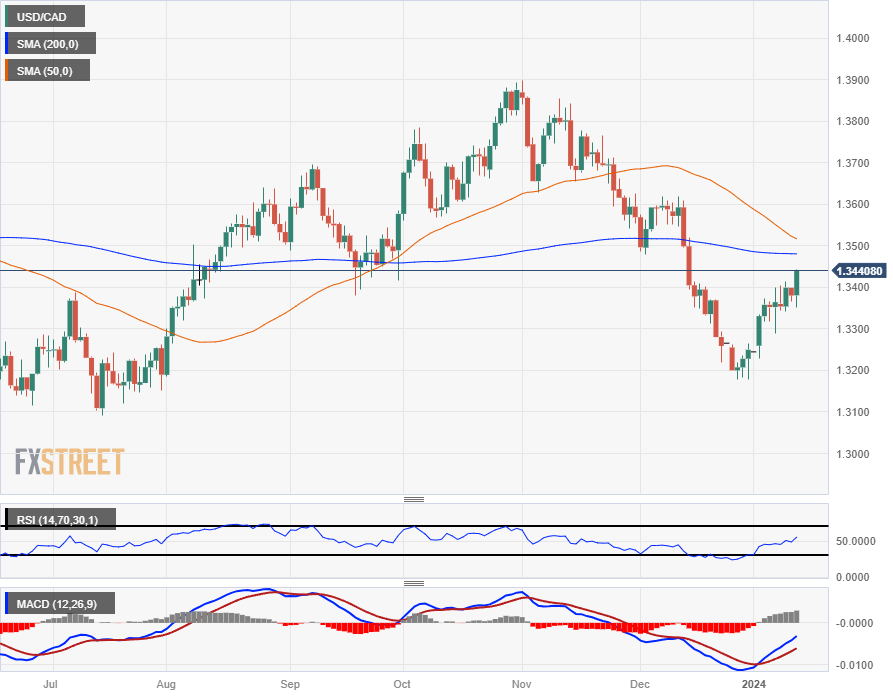
Thursday’s bump in the USD/CAD drags the pair within reach of the 200-day SMA near the 1.3500 handle, but continued bullish momentum faces near-term technical resistance as the 50-day SMA declines, heading into a bearish crossover of the long-term moving average. The USD/CAD has closed flat or bullish for nine of the last ten consecutive trading days and is on pace to make it a tenth green day.
The USD/CAD is now up 2% from late December’s bottom bids near 1.3177 but remains down around 3.3% from October’s peak near the 1.3900 handle.
USD/CAD Hourly Chart
(Click on image to enlarge)
USD/CAD Daily Chart
(Click on image to enlarge)
More By This Author:
USD/CAD Price Analysis: Corrects To Near 1.3360 Ahead Of US Inflation Data
EUR/GBP Pares Gains Towards 0.8600 Ahead Of ECB Economic Bulletin
EUR/USD Edges Higher To Near 1.0980 Ahead Of US CPI Data


Comments
Log in or sign up to join the conversation.