Canadian Dollar Faces Fresh Weakness As Loonie Falters Further

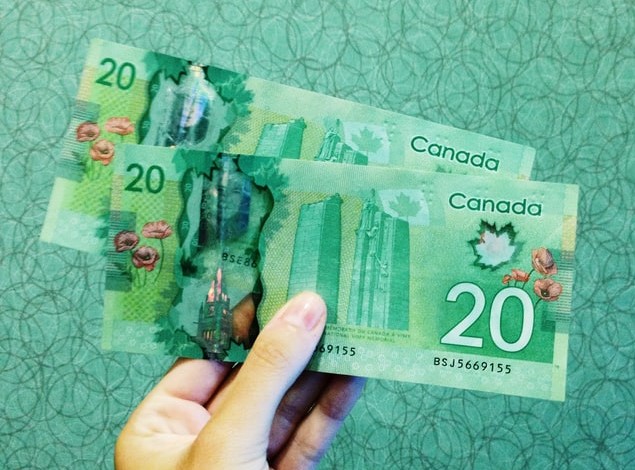
Photo by Michelle Spollen on Unsplash
The Canadian Dollar (USD) caught an extended bout of market weakness on Monday, sinking for a third straight trading day against the US Dollar (USD) and falling back into recent lows, driving the USD/CAD pair back into the 1.4050 region.
The Bank of Canada (BoC) trimmed interest rates by another 25 basis points last week, matching the Federal Reserve’s (Fed) quarter-point rate trim. With the Canadian Dollar’s interest rate differential with the US Dollar moving in lockstep, the Loonie is poised to neither gain nor lose from central bank moves, keeping Loonie traders locked in on an economy that is grappling with trade war fallout. The Canadian economy also relies heavily on Crude Oil market activity, and stubbornly low barrel prices are doing the Loonie no favors.
Daily digest market movers: Canadian Dollar falls further as BoC matches Fed rate moves
- The Canadian Dollar fell for a third straight session against the US Dollar, declining another 0.3%.
- USD/CAD has risen back into the 1.4050 zone, and is poised to take a fresh run at seven-month highs as the Loonie continues to slump against the Greenback.
- The Canadian Dollar has lost ground against the US Dollar for three of the last four straight calendar months.
- Standard & Poor’s Canadian Manufacturing Purchasing Managers Index (PMI) showed that although overall business conditions have improved in October, overall expectations remain on the contractionary side, and business operators continue to expect deteriorating conditions moving forward as trade war tariffs continue to bite at the outside edges of the Canadian economy.
- BoC Governor Tiff Macklem noted on Monday that despite ongoing slack in the Canadian labor market and the need for ongoing stimulus from monetary policy effects, the bulk of US President Donald Trump’s trade tariffs continue to be paid for by American businesses and consumers.
Canadian Dollar price forecast
USD/CAD has seen a positive shift in momentum on daily candlesticks, bringing a sense of optimism after months of steady consolidation and a gentle recovery from the June lows near 1.3350. Recently, price action has broken above both the 50-day and 200-day Exponential Moving Averages (EMA), which are commonly seen as positive signs indicating a potential trend reversal. The 50-day EMA is in the processing of completing a 'golden cross' above the 200-day EMA, adding further weight to odds of a bullish continuation after new exhaustion points. The latest candles reflect strong buying interest following a brief dip to the 1.3850 support level, showing that buyers are eager to step in during dips.
Bids are now testing the resistance zone between 1.4050 and 1.4100, a level that has historically capped rallies since August. A solid daily close above this range could pave the way for a move toward the 1.4300 level, while a failure to break through could lead to a retest of the 1.3900–1.3850 support area for confirmation. The RSI is around 60, indicating there’s still room for additional gains before it becomes overbought. In the near term, traders will be watching to see if momentum can hold above 1.4050 to confirm a breakout, or if rejection at this level hints at a continued range-bound movement.
USD/CAD daily chart
(Click on image to enlarge)

More By This Author:
Dow Jones Industrial Average Dips As AI Investments Drive Broader Market GainsDow Jones Industrial Average's Week-Long Stall Continues On Friday
GBP/USD Tests Six Months Lows As Pound Sterling Continues To Sink


