
Bullish Case For S&P 500 Index

Image Source: Pexels
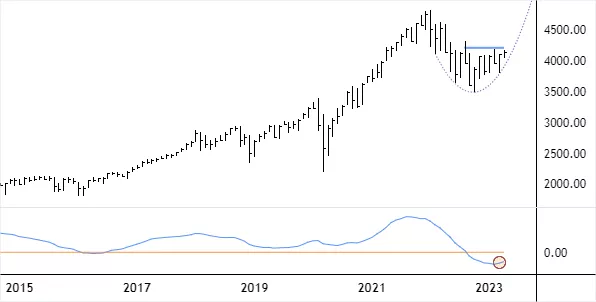
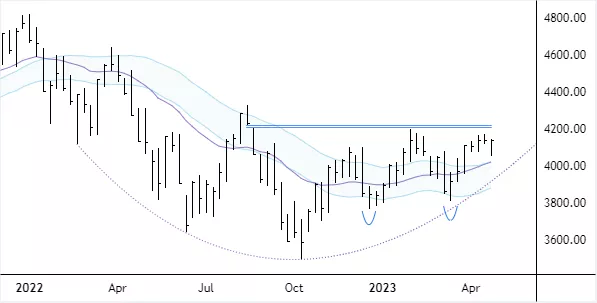
One of my long-term gauges for the S&P 500 index gave a rare buy signal by flipping up below zero at the end of March on the monthly chart. I also like the fact that the index has not closed below my lower channel band this year on the weekly, while there are many closes above the upper band. I expect the index to rise through the 4219 level (blue horizontal lines), given it stays above about 3950.
More By This Author:
Breakout In Marel´s Stock Price As I Expected
Breakout In Value Line Geometric Index
Stock Price Of Marel At Critical Point
How did you like this article? Let us know so we can better customize your reading experience.

Comments
Leave a comment to automatically be entered into
our contest to win a free Echo Show.

