
The GBP/USD pair attracts some buyers around 1.2680 during the early European session on Monday. The decline of the Greenback after softer US Personal Consumption Expenditures (PCE) Price Index data creates a tailwind for the major pair. Investors will keep an eye on the US ISM Manufacturing PMI for June on Monday. The general election in the United Kingdom is scheduled for Thursday.
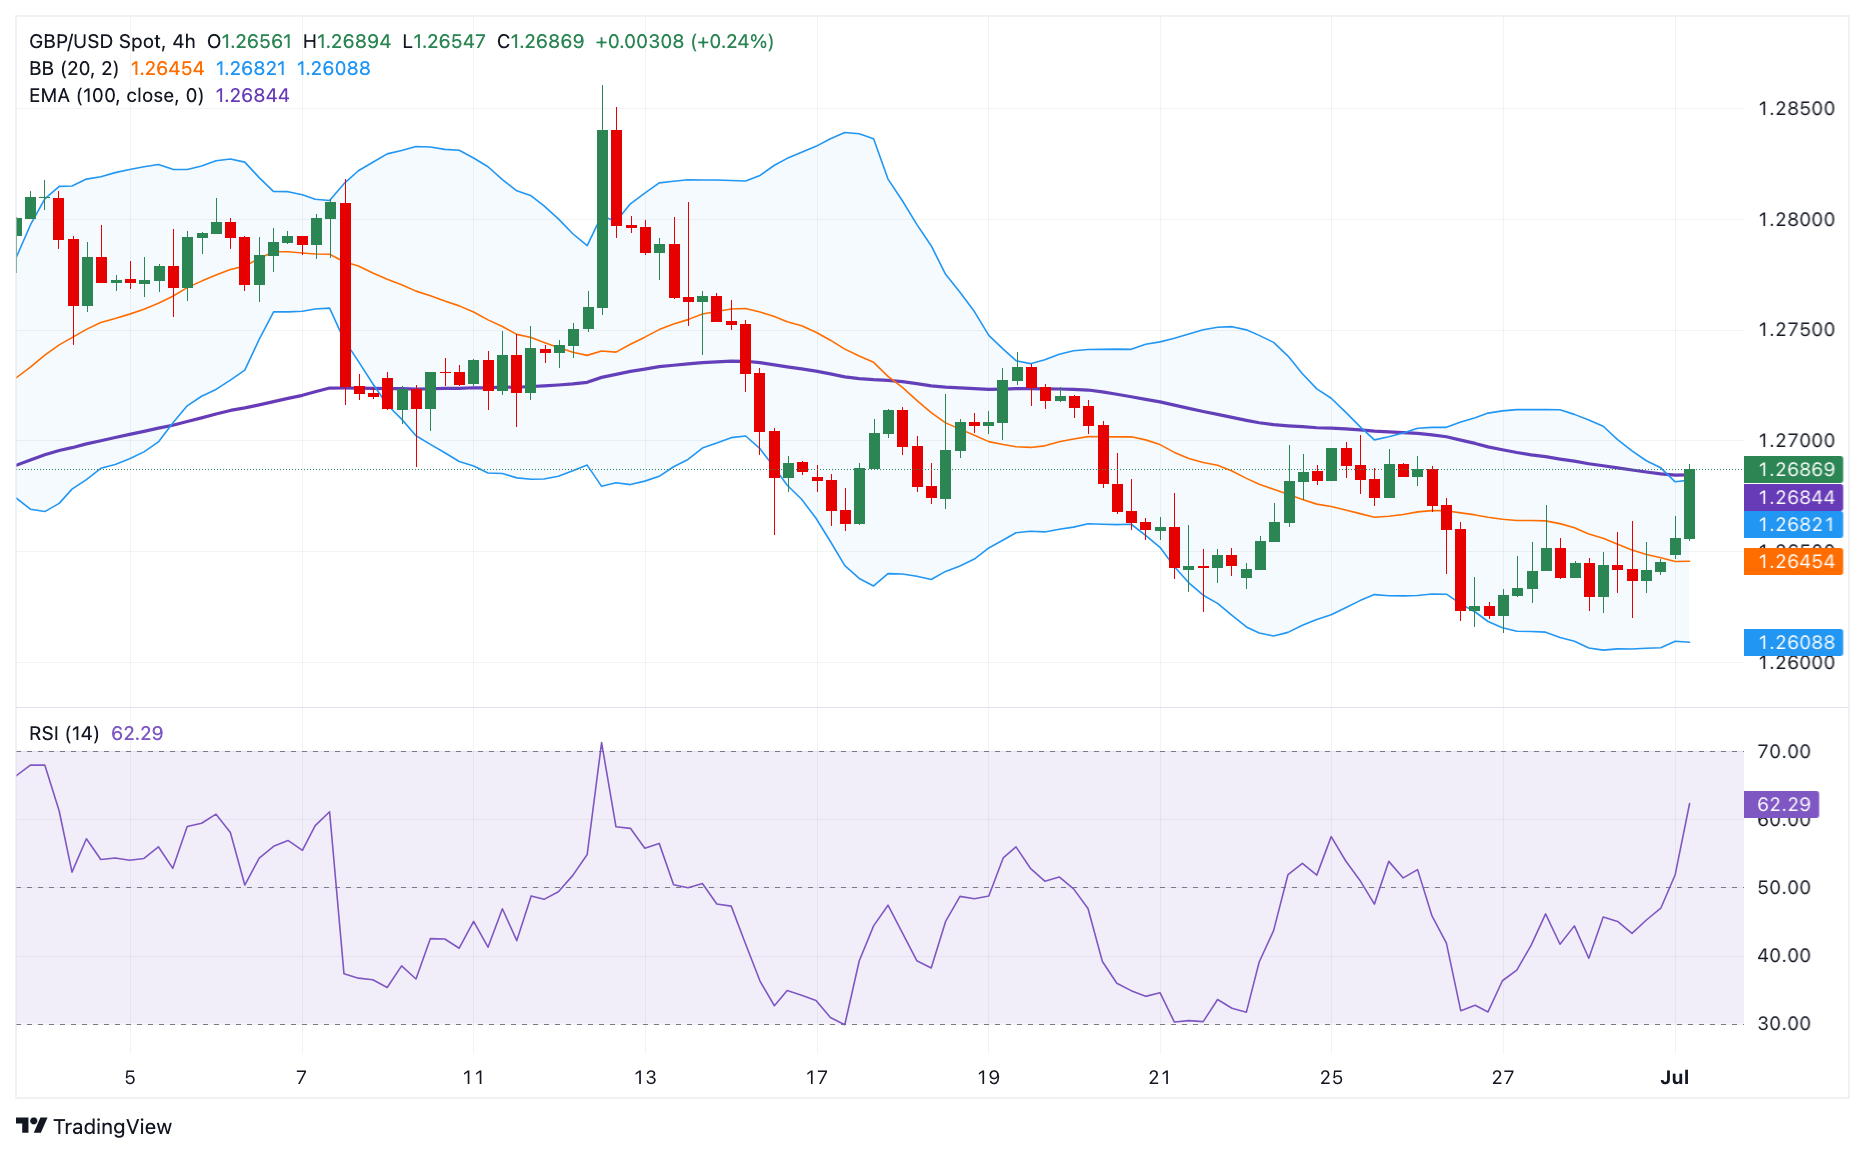
According to the 4-hour chart, the bearish outlook of GBP/USD remains intact as it holds below the key 100-period Exponential Moving Average (EMA). However, the Relative Strength Index (RSI) crosses above the 50-midline, indicating that further upside looks favorable.
The key resistance level for GBP/USD will emerge in the 1.2680-1.2685 zone, portraying the confluence of the upper boundary of the Bollinger Band and the 100-period EMA. A decisive break above this level will see a rally to 1.2700, the psychological level and a high of June 25. Further north, the next hurdle is seen at 1.2740, a high of June 19.
On the flip side, the initial support level for the major pair is located at 1.2610, the lower limit of the Bollinger Band. The additional downside filter to watch is 1.2583, a low of May 15. The next contention level is seen at 1.2502, a low of May 10.
GBP/USD 4-hour chart
(Click on image to enlarge)
More By This Author:
WTI Consolidates Gains Near $82.00 Amid Hope For Strong Summer Driving DemandUSD/CAD Remains On The Defensive Near 1.3650 Ahead Of Canadian CPI Data
USD/CHF Remains On The Defensive Below 0.8850 Ahead Of SNB Rate Decision


Comments
Log in or sign up to join the conversation.