
Broader Market Participation Continues
One common theme in some earlier blog posts this year has been commentary around a market that is seeing broader participation. What is meant by this is the fact more stocks and asset classes are participating in the market's move higher, especially participation outside of the mega cap stocks.
On January 1st I wrote an article, Time For Small Caps?, and in the article it was noted how small company stocks have underperformed their large cap counterparts since 2013. As a firm we eliminated small company stock exposure in client accounts in 2013 and just moved back into the asset class in the third quarter last year and added to the asset class earlier this year.
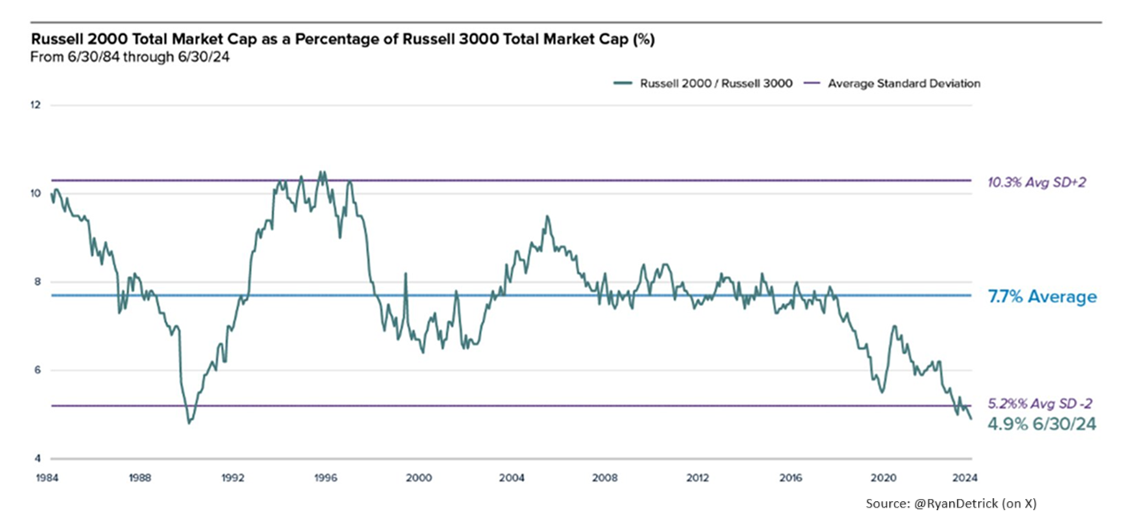
During this stretch of over ten years our firm was out of small cap exposure the disparity in performance between the large cap and small cap companies reached an extreme level. As the below chart shows, the Russell 2000 small company stock index's market cap as a percentage of the Russell 3000 total market index's market cap is a near record low equaling 4.9%. The Russell 3000 Index represents the largest 3,000 U.S. companies and represents about 96% of the investable U.S. equity market. The Russell 2000 Index represents the smallest 2000 companies within the Russell 3000 Index and represents about 7% of the Russell 3000 total market capitalization. One takeaway from the below chart is small cap could outperform for some time once it gains upside traction.
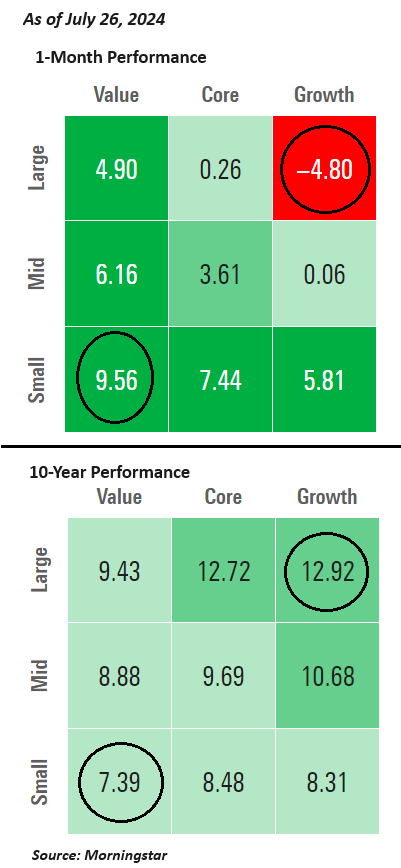
The below chart represents the return of the various asset classes and styles as defined by Morningstar. The top chart displays the 1-month return and shows large cap growth stocks are down -4.8% while small cap value stocks are up 9.56%. This is a significant spread in performance over the last 30-days. The lower half of the chart shows the style box annualized returns over the last 10 years and large company stock returns have a decided advantage. It would not be surprising if investors saw a reversion to the mean between large growth and small value, i.e., small cap stocks outperform and large cap stocks underperform.
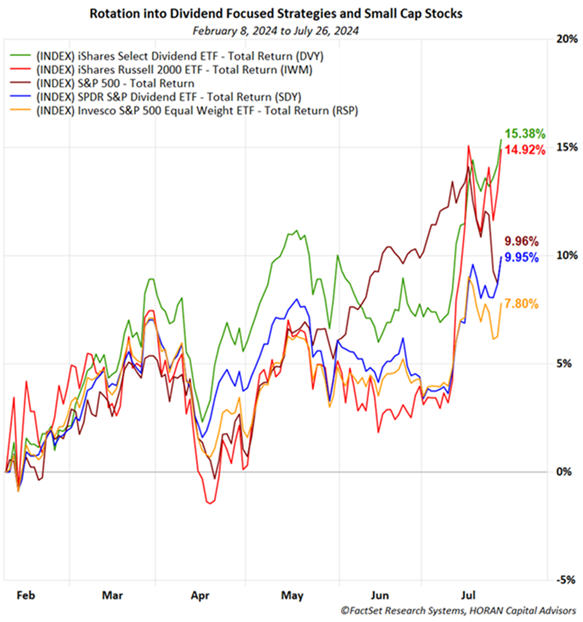
Another area outside of the small cap stock space that has significantly underperformed the mega cap stocks is the higher quality dividend paying stocks. In a May article this year, Dividend Payers Outperforming Broader Market, I highlighted returns for the dividend payers for the three months ending in May. I note this as the below charts show the returns starting in February, which would be the starting point for the three months as of May returns in the earlier article. The green line on the below chart is the iShares Select Dividend ETF and the return is 15.38% versus 9.96% for the S&P 500 Index. There are other dividend ETF's on the chart and it is important for investors that they do their own homework on the specific investments as not all dividend ETF's are constructed in the same way. Notable though is some of these other dividend strategies continue to trail the broader market. Maybe there is an opportunity for investors in this higher quality stock space even as small company stocks continue to outperform the large cap S&P 500 Index since February 8.
With the focus on rotation, one area ripe for potential selling is within the Magnificent 7 stocks. Up until earlier in July, the Mag 7 stocks were contributing an outsized amount to the market's overall return. Over the last several weeks the Mag 7 are seeing some profit taking as seen with the dark blue line in the below chart which is the Magnificent 7 ETF (MAGS). The two lines showing positive returns are the iShares Russell 2000 small cap ETF (IWM) and the iShares Select Dividend ETF (DVY).

In summary, the U.S. equity market has generated strong returns over the last year and a half with the strength mostly in the large company stock space. It seems evident that investors are rotating out of some of these higher performing areas and into the smaller companies and higher quality dividend payers that have lagged the market for a number of years. This activity is a healthy sign that could continue to result in equity prices moving higher in the back half of the year. Importantly though the market does not move higher in a straight line and the fact the S&P 500 Index was recently down almost 5% from its recent high is evidence of this. Also, investors should note smaller company stocks tend to be more volatile, that is, have a higher level of risk. Investors need to do their own research and evaluate whether or not this higher risk exposure is in line with one's risk tolerance.
More By This Author:
Rotation Into Small Cap Stocks
The Magnitude Of The Difference In Return A Greater Issue Than A Narrow Market
Dividend Payers Outperforming Broader Market
Disclaimer: The information and content should not be construed as a recommendation to invest or trade in any type of security. Neither the information nor any opinion expressed constitutes a ...
more

