
In a 9th November blog post, I wrote that the US TMS (True Money Supply) growth rate had fallen far enough to suggest that the next trend reversal in credit spreads from narrowing to widening would mark the start of a boom-to-bust transition rather than just an interruption to the boom. What’s the current situation?
Before answering the above question it’s worth reiterating that a trend reversal in credit spreads (from narrowing to widening) isn’t the only early warning that a boom-to-bust transition has begun for the US economy. As mentioned in previous blog posts (for example, HERE), another necessary signal is pronounced weakness in the Industrial Metals Index (GYX) relative to the gold price. In other words, prior to the end of a boom* there will be upward trend reversals in credit spread indicators such as the US High Yield Index Option-Adjusted Spread (HYIOAS) and a downward trend reversal in the GYX/gold ratio. As an aside, the most recent bust began in early October of 2018 and ended in early June of 2020.
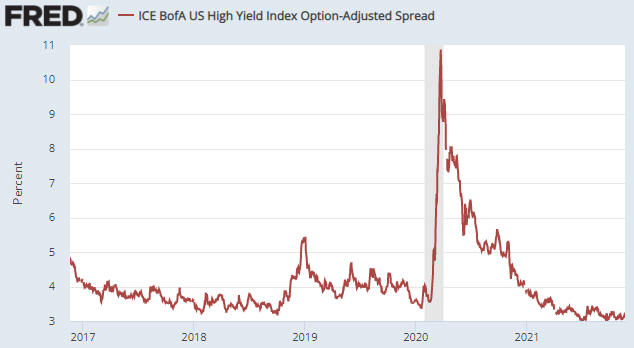
The following daily chart shows the HYIOAS.
In early July of this year, the HYIOAS was at its lowest level in more than 10 years and not far from an all-time low. It spiked upward around the middle of July and then returned to near its low, where it remains (it ended last week at around 3.2%).
Note that a credit-spread reversal would be signalled by the HYIOAS making a higher short-term high AND moving back above 4%. The first of these criteria (the initial warning) would be triggered by a move above 3.5%.
The next chart shows the GYX/gold ratio. To generate a boom-to-bust warning the line on this chart would have to make a sustained break below its 200-day moving average.
(Click on image to enlarge)
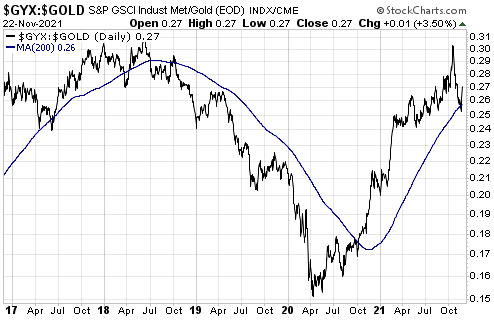
Neither of the indicators that in the past have always warned prior to the start of a boom-to-bust transition for the US economy has triggered, although it would not take much additional weakness in GYX relative to gold for the GYX/gold ratio to generate a warning signal. This implies that the US economic boom that began during the second quarter of 2020 is intact. Furthermore, as things currently stand it looks like the start of a boom-to-bust transition is still at least a few months away.
*An economic boom is a period of generally rapid economic activity fuelled by monetary inflation. It does not necessarily involve sustainable economic progress. In fact, most of the apparent gains achieved during the boom tend to be relinquished during the subsequent bust.


Comments
Log in or sign up to join the conversation.