
Bitcoin Needs To Reconquer $4,539 In Order To Avoid The Abyss Below $4,000
Where will the free-fall of Bitcoin stop? After a downfall on November 14th, BTC/USD had a bad day on Monday that became worse today. At least it’s doing better than Bitcoin Cash, which crashed 40% in 24 hours. What are the levels to watch?
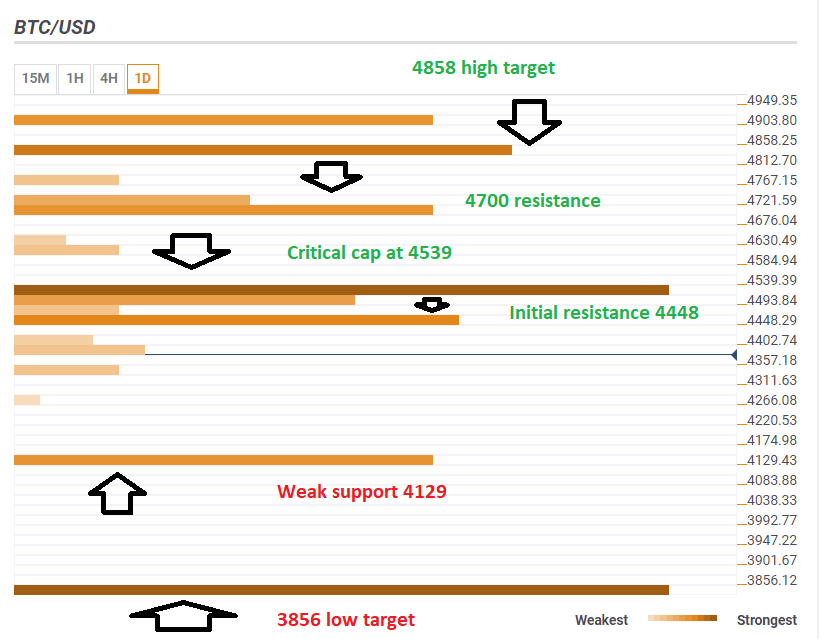
The Technical Confluence Indicator shows that initial resistance awaits at $4,448 which is the convergence of the Pivot Point one-day Support 1 and the Bollinger Band 15-Middle.
However, a crucial level is $4,539. Here we see the confluence of the all-important Pivot Point one-week Support 2, the previous 4h-high, and the Simple Moving Average 10-1h. As the chart shows, this is a critically strong level. Recapturing it would provide some relief and prevent imminent further falls.
It would also open the door to higher levels: the are of $4,700 is the meeting point of the Bollinger Band 4h-Lower and yesterday’s high. Next up, we find the SMA 100-15m, the SMA 5-4h at $4,858.
If this does not happen and BTC/USD resumes its falls, $4,129 is the initial target: it is the Pivot Point one-day Support 2.
However, that line is not that robust and a much more significant support line is only at $3,856 which is the top-tier Pivot Point one-month Support 3.
Here is how it looks on the tool:
The Confluence Detector finds exciting opportunities using Technical Confluences. The TC is a tool to locate and point out those price levels where there is a congestion of indicators, moving averages, Fibonacci levels, Pivot Points, etc. Knowing where these congestion points are located is very useful for the trader, and can be used as a basis for different strategies.
Disclaimer: Foreign exchange (Forex) trading carries a high level of risk and may not be suitable for all investors. The risk grows as the leverage is higher. Investment objectives, risk appetite and ...
more

