Bitcoin Elliott Wave Cycles Point At Least Three-Wave Drop
There were no big changes in the Crypto market since yesterday. We are still expecting more weakness after a recent sharp and impulsive decline and the main reason we see 2/3 in the stock market, where many of the single stocks correlated to Crypto can be showing bearish setups.
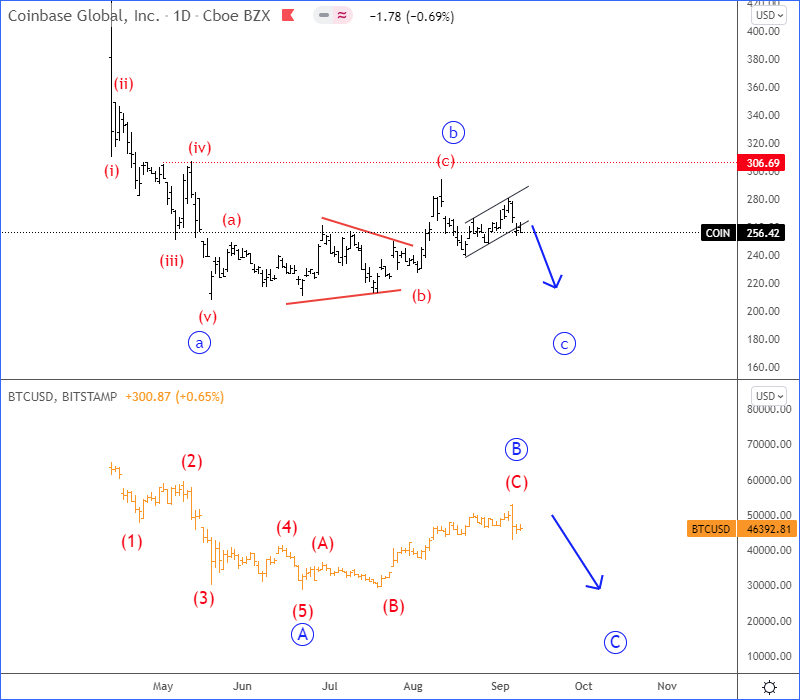
We are talking about Coinbase and Tesla, in which we see nice bearish patterns. Coinbase can be forming a new intraday bearish setup after a three-wave corrective recovery, which suggests more downside pressure ahead.
Coinbase Vs Bitcoin Elliott Wave Analysis Chart
(Click on image to enlarge)

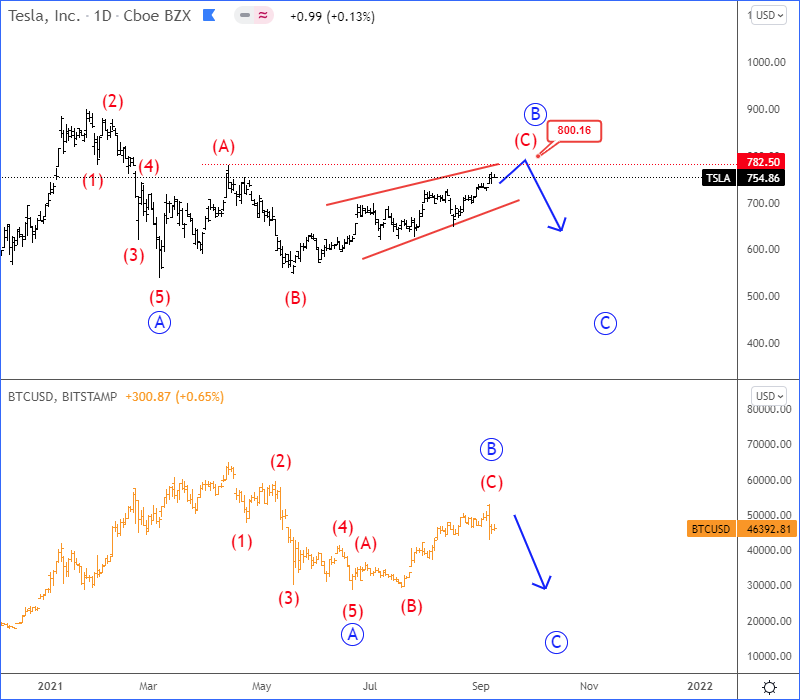
And Tesla, one of the biggest BTC investors can be finishing an ending diagonal (wedge) pattern within wave C of B.
Tesla vs Bitcoin Elliott Wave Analysis Chart
(Click on image to enlarge)

All that being said, if we respect the wave structure, price action, and correlations in the market, then it's a high probability that bears are back.
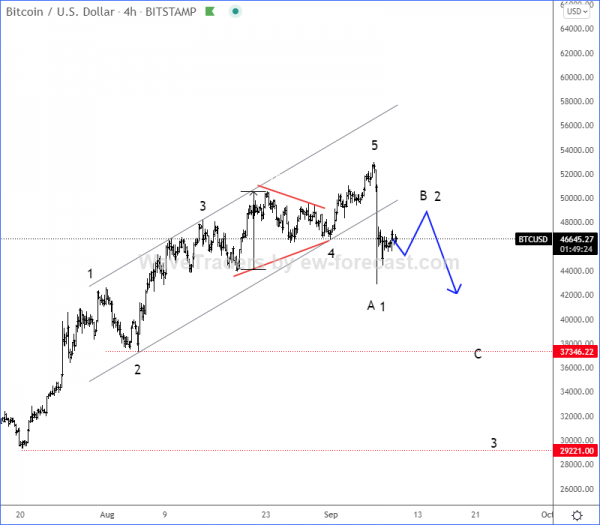
Bitcoin, BTCUSD turned sharply down from projected and important resistance zone in the 4- hour chart, so seems like the five-wave cycle is completed and we can now expect a reversal at least in three waves A/1- B/2-C/3 and least back to 37k area for C of a correction, if not even lower towards 30k for wave 3 of a new five-wave bearish impulse.
Bitcoin 4h Elliott Wave Analysis Chart
(Click on image to enlarge)

Disclosure: Please be informed that information we provide is NOT a trading recommendation or investment advice. All of our work is for educational purposes only.


An interesting sales pitch for the Elliot Wave Theory. Is there any math behind it, or is it only a graphics analysis? Just wondering.
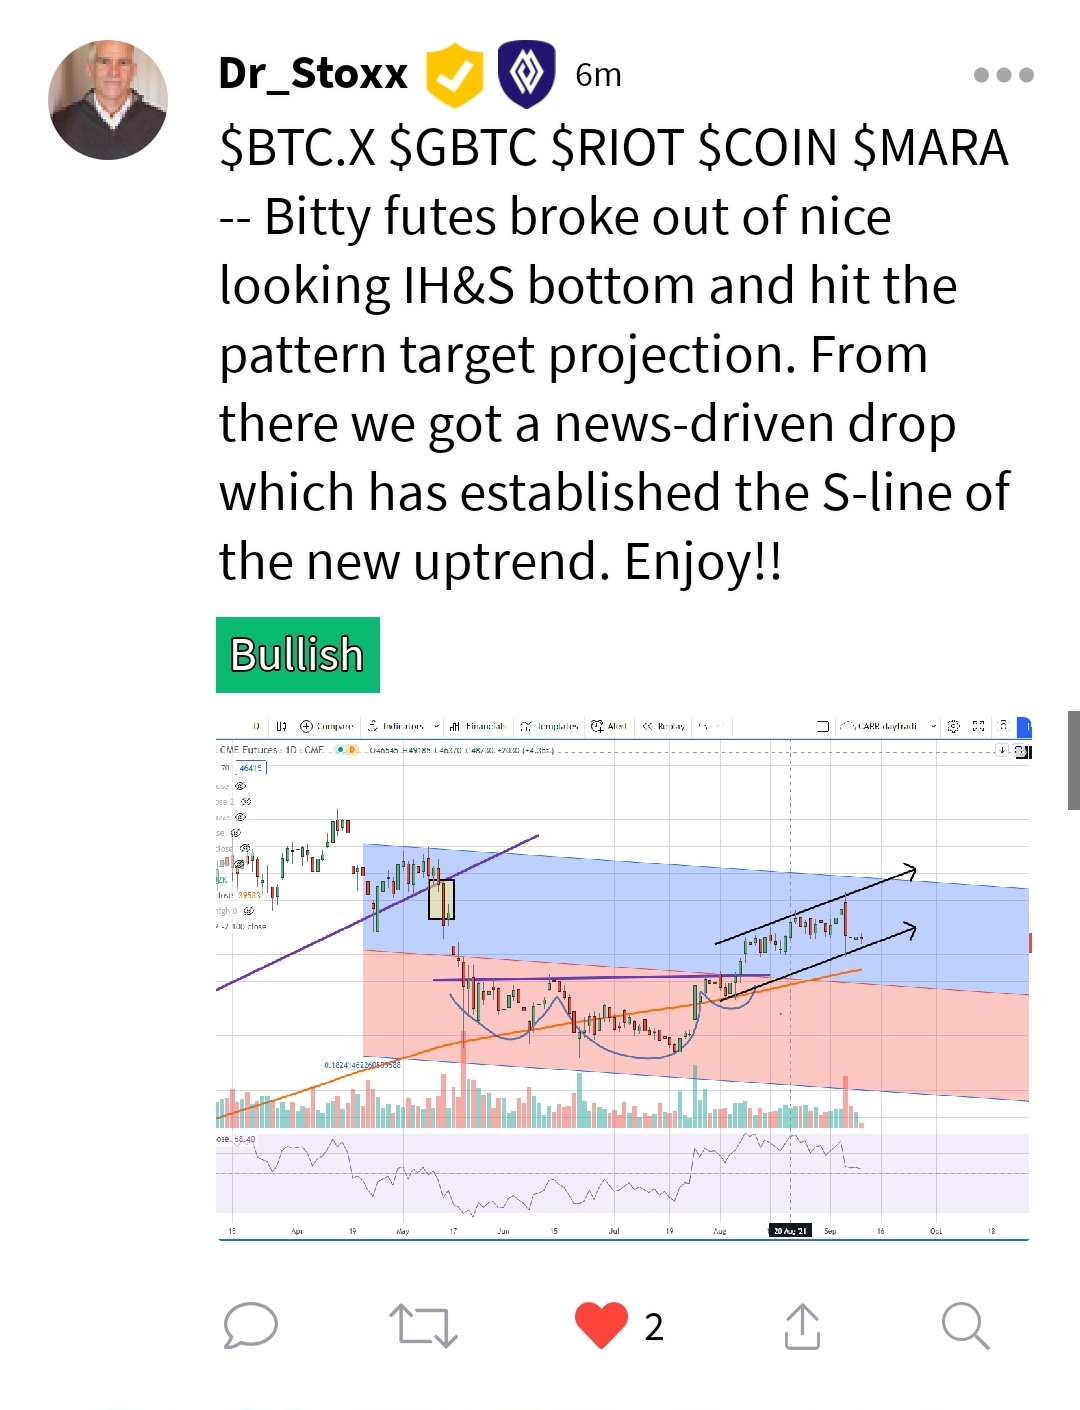
Battle of the interpretations.
