Wednesday, September 25, 2019 5:49 AM EDT
BITCOIN (BTC) PRICE SLUMPS AS TECHNICAL LEVELS FOLD
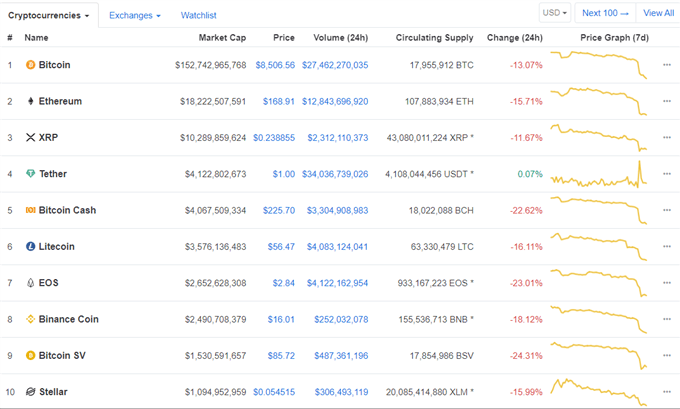
After a few weeks of thin trading ranges and low volumes, the cryptocurrency market burst into life Tuesday as the market sold-off sharply, with double-digit losses seen across the market. At one stage, the cryptocurrency market lost nearly $39 billion in market capitalization as sellers tried to find bids.
Bitcoin Price Outlook – Preparing a Move or Death by a Thousand Cuts?
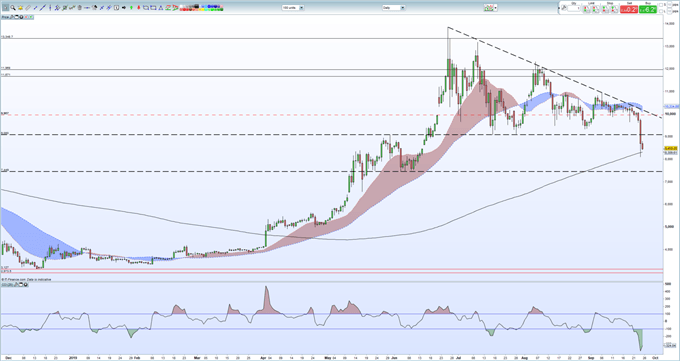
There is no one clear reason for the sell-off, but the daily chart has been warning of a move for the last 2-3 weeks as a descending wedge (triangle) pattern took shape. The moment the horizontal support line at $9,080 was broken, the sell-off accelerated all the way down around $8,000 before a small pullback.
Looking ahead, current support is based off the 200-day moving average around $8,300, before a cluster of early-mid June lows near $7,500 come into play. The worry for holders of Bitcoin is that a full measured move of the descending wedge could see BTC hit as low as early-mid $4000s – ($13,840 - $9,080 = $4,720. Then $9,080 - $4,720 = $4,365).
Bitcoin needs to break back above the descending slope, currently around $10.200 to regain any bullish momentum. The CCI indicator does suggest that BTC is heavily oversold and this may stem further losses in the short-term.
BITCOIN DAILY PRICE CHART (DECEMBER 2018 – SEPTEMBER 25, 2019)
IG Client Sentiment data show that 83% of retail traders are net-long Bitcoin (BTC), a bearish contrarian indicator.
Disclaimer: DailyFX, the free news and research website of leading forex and CFD broker FXCM, delivers up-to-date analysis of the ...
more
Disclaimer: DailyFX, the free news and research website of leading forex and CFD broker FXCM, delivers up-to-date analysis of the fundamental and technical influences driving the currency and commodity markets. With nine internationally-based analysts publishing over 30 articles and producing 5 video news updates daily, DailyFX offers in-depth coverage of price action, predictions of likely market moves, and exhaustive interpretations of salient economic and political developments. DailyFX is also home to one of the most powerful economic calendars available on the web, complete with advanced sorting capabilities, detailed descriptions of upcoming events on the economic docket, and projections of how economic report data will impact the markets. Combined with the free charts and live rate updates featured on DailyFX, the DailyFX economic calendar is an invaluable resource for traders who heavily rely on the news for their trading strategies. Additionally, DailyFX serves as a portal to one the most vibrant online discussion forums in the forex trading community. Avoiding market noise and the irrelevant personal commentary that plague many forex blogs and forums, the DailyFX Forum has established a reputation as being a place where real traders go to talk about serious trading.
Any opinions, news, research, analyses, prices, or other information contained on dailyfx.com are provided as general market commentary, and does not constitute investment advice. Dailyfx will not accept liability for any loss or damage, including without limitation to, any loss of profit, which may arise directly or indirectly from use of or reliance on such information.
less
How did you like this article? Let us know so we can better customize your reading experience.


