
Bearish Signs Continue – Weekly Market Outlook
While there's no denying last week was a rough one for the market, from one perspective, stocks still look like they've got a chance at recovering again. From another perspective though, the floor has already been broken, opening the door to a much more substantial dip.
We'll take a look at how the market may already be past the point of no return in a moment. Let's first take a look at the economic numbers that ultimately spurred the selloff last week.
Economic Data
Last week was relatively busy in terms of economic news, but the FOMC's decision on Wednesday and Friday's GDP figure were the biggest… and the worst.
On Wednesday, the Federal Reserve affirmed it was still thinking it would likely raise interest rates in the latter half of this year. That's a problem for investors, though, who had apparently come to think a few economic red flags that began waving since the prior Fed confab would lead to a more dovish, accommodative stance. Stocks got hit hard that day. They bounced back a little on Thursday. But, when the Bureau of Economic Analysis said Q4's GDP growth rate was only 2.6% versus expectations of 3.2% growth, the market fell hard again. In fact, it's back to the brink of falling under a critical support level.
GDP Growth Trend Chart
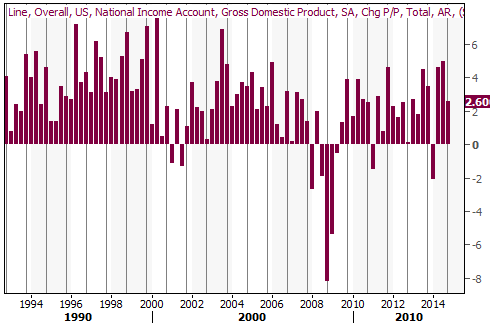
Source: Thomson Reuters Eikon
It was also a big week for sentiment data. The Conference Board said January's consumer confidence reading reached a multi-year high of 102.9. Meanwhile, the Michigan Sentiment Index ended up at 98.1 for January, which was also a multi-year effort.
Consumer Sentiment Chart
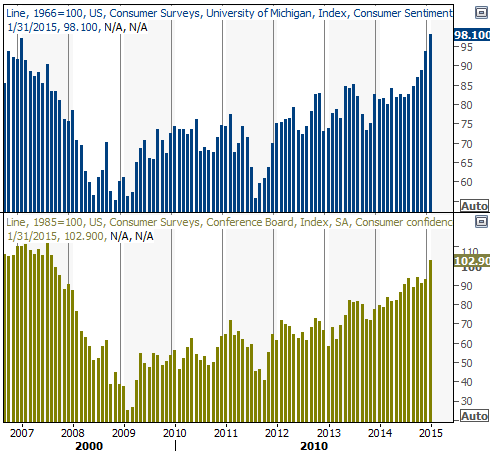
Source: Thomson Reuters Eikon
There was a handful of other, albeit less important, news last week too. Durable orders fell rather sharply (-3.4%), for the fifth month in a row. New home sales hit a pace of 481,000, which is actually the best pace we've seen since 2008. Simultaneously, the Case-Shiller 20-City Index indicates home prices were up 4.3% on a year-over-year basis in November.
Economic Calendar

Source: Briefing.com
This week is clearly going to be a big one too, in terms of economic information. The only data that's really going to matter, however, is Friday's update on the nation's employment situation.
As of the latest look, economists don't expect January's unemployment rate to change from December's figure of 5.6%. The same pros believe the economy added 235,000 new payrolls last month, down slightly from December's tally of 252,000. We're making good progress on the unemployment front, but only modest progress on the job-growth front.
Unemployment Trends Chart
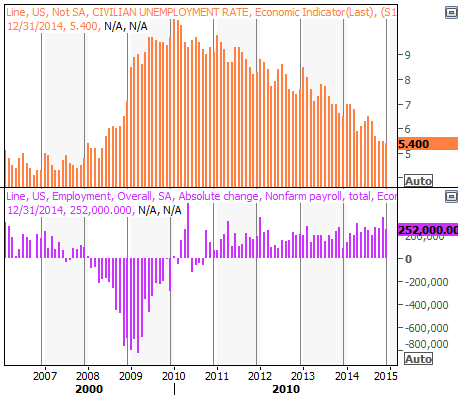
Source: Briefing.com
The real litmus test is going to be data you don't see discussed in the usual media coverage of the nation's employment news…. the labor force participation rate, and overall employment ratio (of the entire population). Both have stabilized in recent months, but neither has started to make a firm move back to normalized levels.
Participation Rates Chart
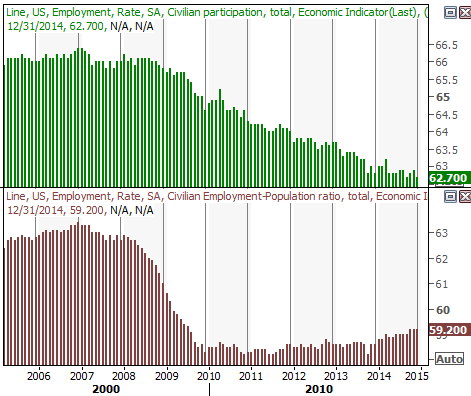
Source: Briefing.com
Stock Market Index Analysis
This week's analysis is actually a rather simple, straight-forward one – the market is on the verge of a fairly big technical breakdown. One more bearish day (maybe two) could potentially push stocks past the point of no return on a short-term basis.
The daily chart of the S&P 500 (SPX) (SPY) below came within striking distance of a break to new lows on Friday. The key line that was tested was the 1993 mark, where the index hit a low three weeks ago, and in the first part of January. We've obviously not seen a break under that floor, but we're close.
S&P 500 & VIX – Daily Chart
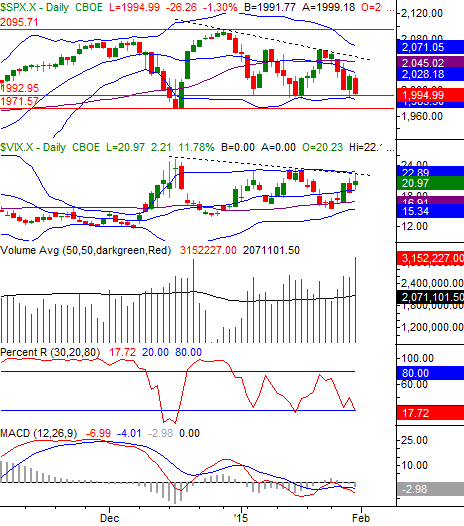
Chart created with TradeStation
With that being said, just for good measure we may want to keep a close eye on what happens when-and-if the December low of 1971 is broken. At that point the S&P 500 would be well under the lower Bollinger band too. Such a move would also pull the Percent R line below the key 20.0 level that confirms a bearish trend; we already have a bearish MACD cross that occurred under the zero line. [These are just confirming clues that a downtrend has taken hold.]
You can pretty much count on the CBOE Volatility Index (VIX) (VXX) popping above its near-term resistance line (dashed) at 21.5 if the market slips again. So, count that as a confirmation clue as well. Speaking of the VIX….
One of the key reasons it's been so easy to be pessimistic since late December is how firmly the VIX has been rocking its way out of a modest downtrend and into an uptrend. You can't even really see it happening on the daily chart, but on the weekly chart the VIX has obviously left behind a string of higher lowers while simultaneously putting persistent pressure on the ceiling around 21.7. It's not happened yet, but the VIX is acting like it wants to make the shift. It's not necessarily bearish for stocks in the long run, but in the short run, that could put downward pressure on the market not unlike what we saw in October. There's no guarantee we'll find a bottom as quickly as we did in October though.
S&P 500 & VIX – Weekly Chart
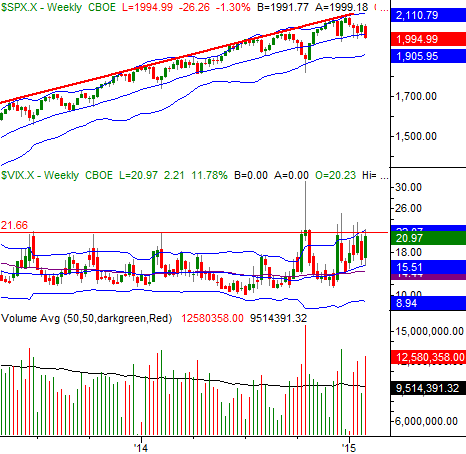
Source: TradeStation
It's also on the weekly chart we can see the S&P 500 has already broken under its 26-week moving average line (the mid-line between the 26-week Bollinger bands on our chart) as of Friday. This is a big deal, as it represents a major shift in how well this level performs as support. With the exception of October's sharp dip, the 26-week moving average line has been perfect support since mid-2013. Now we've seen it fail as support in two of the past three tests. This is a subtle hint that the market may already be too far into selloff mode to stop now.
Almost needless to say, this is a do-or-die time for the bulls. A break under the 1993 level could be a big problem for the S&P 500, and a break under 1971 would seal the deal. Yes, it's still possible the rally could rekindle. We wouldn't trust the rally until the S&P 500 pushed all the way back above the 2045 mark though. Problem is, it would have to fight its way past a big swath of resistance – and move against the tide – to even get in position to do so. The odds favor the current bearish momentum.
As for downside targets should this pullback continue to develop, we'll start with 1905, which is where the weekly chart's lower 26-week Bollinger band currently lies. That line was the prod for the October turnaround.
Disclosure: None.


