
Bear Market Rally Will Stall Or Accelerate Based On This Week's Closes
The bear market for stocks began when the five major equity averages began to crash in early-October. At the end of September, the 12x3x3 weekly slow stochastic readings were above 90.00 on a scale of 00.00 to 100.00. Readings above 80.00 are overbought and I consider readings above 90.00 as an “inflating parabolic bubbles” and bubbles always pop. By mid-October the weekly charts became negative.
At the Christmas bottom the five major equity averages were oversold with stochastic readings below 20.00 and each were down by 20% or more from their all-time intraday highs. The S&P 500 provided the signal that a rebound would happen when it held its “reversion to the mean” (200-week simple moving average) at 2,348.81 on December 26.
The signal that a bear market rally could be sustained came from the Dow Jones Transportation Average. My call as 2019 began was that Dow Transports would hold my new semiannual value level of 8,858 and the low was 8,850.49 on January 3. On January 4, transports closed that week above its reversion to the mean at 9,108.77, confirming the bear market rally.
We begin this week with all five averages still in correction territory, down between 11% and 17.2% from their 2018 highs. On the other side of the coin all five major averages are up between 10.5% and 14.2% above their Christmas lows.
For the bear market rally to continue all five averages need to close this week above their five-week modified moving averages as the 12x3x3 weekly slow stochastic readings are rising above the oversold threshold of 20.00. These averages are explained below.
The Scorecard for December 11, 2019
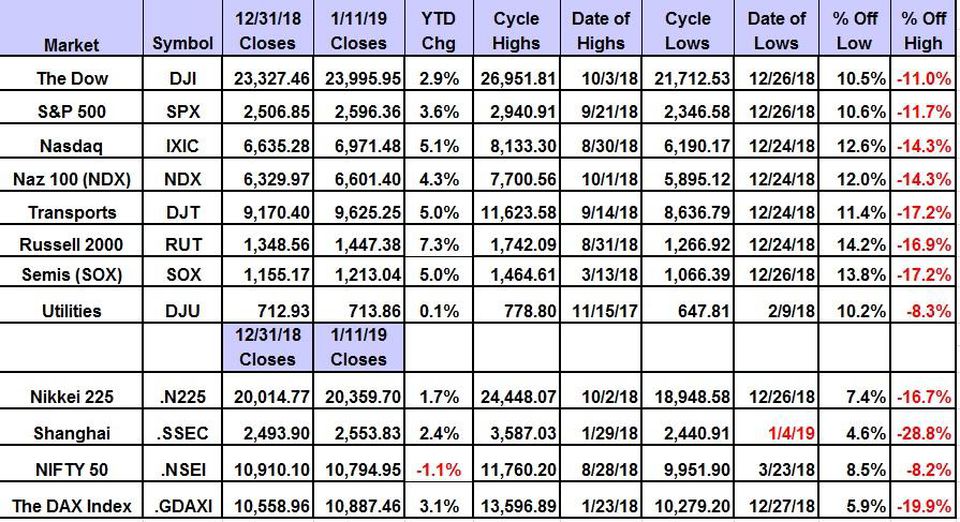
Scorecard For The Major AveragesGlobal Marker Consultants
The Dow Jones Industrial Average (23,995.95 on January 11) set its all-time intraday high of 26,951.81 on October 3 and is in correction territory, 11% below this high. The weekly chart will shift to positive given a close on January 18 above its five-week modified moving average at 24,022. The 12x3x3 weekly close stochastic reading ended last week at 26.07, rising from 19.83 on January 4, moving above the oversold threshold of 20.00. The Dow is up 10.5% from its December 26 low of 21,712.53. My weekly value level is 22,419 with semiannual, monthly and annual risky levels at 24,340, 25,578 and 25,819, respectively.
The S&P 500 Index (2,596.26 on January 11) set its all-time intraday high of 2,940.91 on September 21 and is in correction territory, 11.7% below this level. The weekly chart will shift to positive given a close on January 18 above its five-week modified moving average at 2,596.45. The 12x3x3 weekly close stochastic reading ended last week at 25.45, rising from 18.49 on January 4, moving above the oversold threshold of 20.00. The S&P is up 10.6% since trading as low as 2,346.58 on Deember. 26. My weekly value level is 2,426.5 with semiannual, monthly and annual risky levels at 2,668.8, 2,805.5 and 2,867.1, respectively.
The Nasdaq Composite (6,971.43 on January 11) set its all-time intraday high of 8,133.30 on August 30 and is in correction territory, 14.3% below the high. The weekly chart ended last week positive and will remain so given a close on January 18 above its five-week modified moving average at 6,917.75. The 12x3x3 weekly close stochastic reading ended last week at 24.62, up from 17.26 on January 4, moving above the oversold threshold of 20.00. The Nasdaq is up 12.6% since trading as low as 6,190.17 on December 24. My weekly value level is 6,474 with semiannual, annual and monthly risky levels at 7,274, 7,370 and 7,753, respectively.
Dow Jones Transportation Average (9,625.25 on January 11) set its all-time intraday high of 11,623.58 on September 14 and is in correction territory, 17.2% below the high. The weekly chart will shift to positive given a close on January 18 above its five-week modified moving average at 9,695.58. The 12x3x3 weekly close stochastic reading ended last week at 20.27, rising from 16.47 on January 4, moving above the oversold threshold of 20.00. Transports is up 11.4% since trading as low as 2,346.58 on December 26. My semiannual value level is 8,858 with monthly, quarterly and annual risky levels at 10,511, 10,882 and 10,976, respectively.
The Russell 2000 (1,447.38 on January 11) set its all-time intraday high of 1,742.09 on August 31 and is in correction territory, 16.9% below the high. The weekly chart ended last week positive and will remain so given a close on Jan. 18 above its five-week modified moving average at 1,431.35. The 12x3x3 weekly close stochastic reading ended last week at 20.76, up from 12.79 on Jan. 4 moving above the oversold threshold of 20.00. The Russell 2000 is up 14.2% since trading as low as 1,266.92 on December 24. My weekly value level is 1,313.89 with semiannual, annual, monthly and quarterly risky level at 1,504.17, 1,590.63, 1,597.36 and 1,619.28, respectively.
Disclosure: I hold no positions Chevron, IBM, Coca Cola, Merck, Pfizer, Procter & Gamble, Verizon or ExxonMobil.


